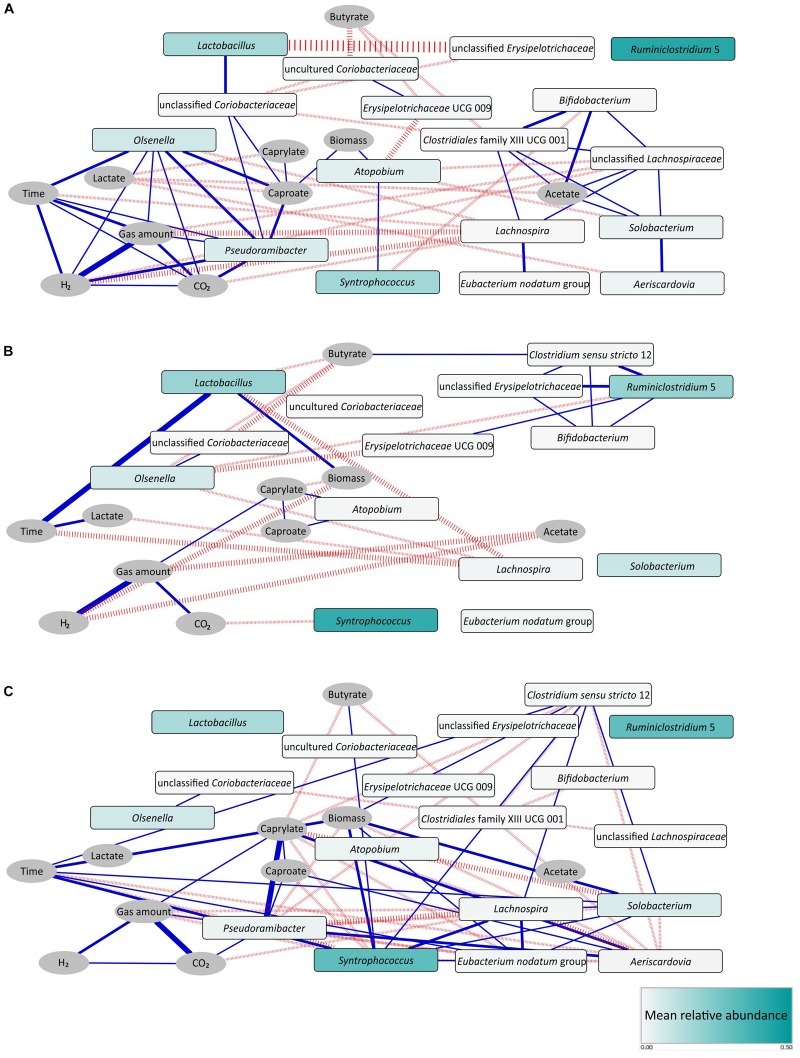
FIGURE 5.
Correlation networks for stage I (A), stage II (B), and stage I - transition stage - stage II (C). Pearson, Spearman, and Kendall correlation coefficients were computed for each pair of microbial taxa (rectangular nodes) and abiotic parameters (elliptic nodes) over the respective period using absolute taxon abundances. Edges indicate a coefficient > 0.75 for positive correlations (blue edges) and < –0.75 for negative correlations (red edges). Edge thickness indicates the number of methods supporting the correlation (1 to 3). Shading of the microbial taxon nodes indicates mean relative abundance over the respective period. Note the identical node layout in both networks. To ease comparison, also unconnected nodes are shown that feature correlations in the other network. However, unconnected nodes with zero abundance were removed, like Pseudoramibacter and Aeriscardovia in the network of stage II.

