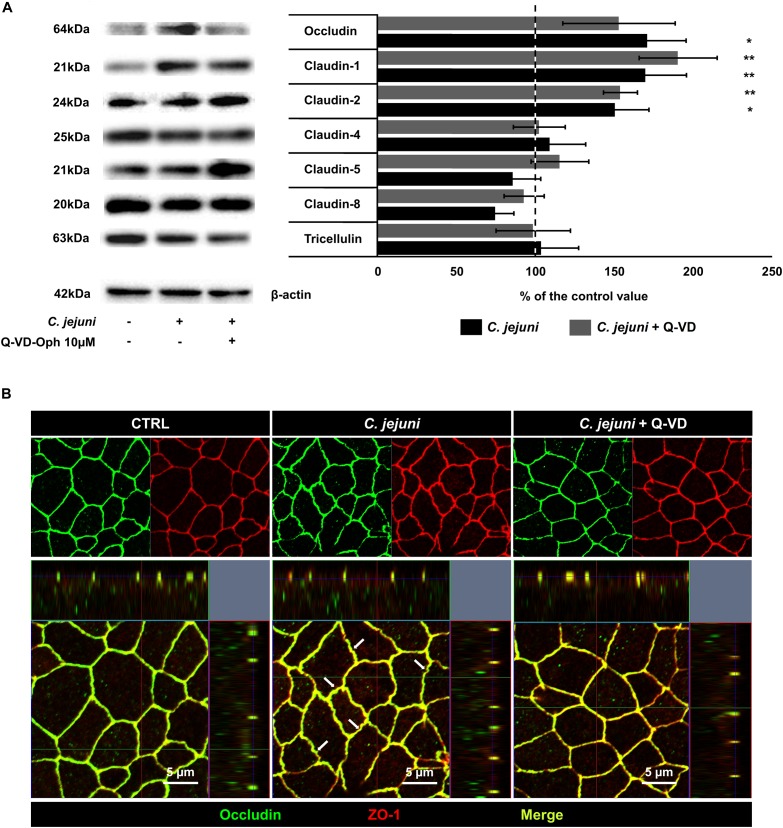
FIGURE 4.
Expression of tight junction proteins in C. jejuni-infected co-cultures 22 h post-infection. Co-cultures of HT-29/B6-GR/MR and THP-1- cells were infected with C. jejuni with or without apoptosis inhibitor Q-VD-OPh. (A) Western blot was performed on the cell lysates 22 h after infection. Expression level of tight junction proteins was normalized with β-actin. Immunoblots were subjected to densitometric analysis. The dashed line represents control value set to 100%. Q-VD-OPh control treatment did not change the expression level of the described tight junction proteins compared to untreated controls (data not shown). Data are presented as mean values in percent of the control values, ± SEM. n = 7–9, *p < 0.05, **p < 0.01, unpaired Student’s t-test with Bonferroni-Holm adjustment for multiple comparisons. (B) The cell monolayers were analyzed by confocal microscopy after immunofluorescence staining. The micrographs show the localization of the tight junction proteins occludin (green) and zonula occludens protein-1; ZO-1 (red) at cell borders. The merge (yellow) image represents the co-localization of the tight junction proteins in a single plane of a Z-stack. White arrows indicate zigzag pattern of bicellular cell-cell contacts in C. jejuni-infected monolayers.

