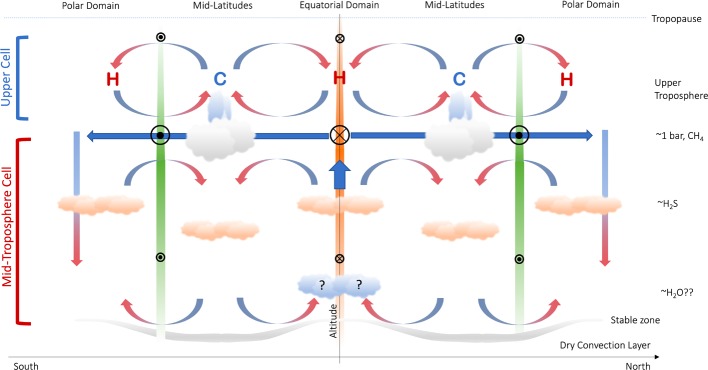
Fig. 6.
Schematic representation of stacked cells within an ice giant atmosphere. The equatorial retrograde jet is shown in orange and decays both above and below the clouds (Conrath et al. 1998; Tollefson et al. 2018). No eddy momentum fluxes are included here. The gradient in methane from equator to pole is shown as the thick blue arrow for bar, whereas the mid-latitude upwelling and equatorial/polar subsidence is shown for bar. Strong polar subsidence then explains the microwave brightness and NH3/H2S depletion. The variable thickness of a stable layer associated with water clouds is pure conjecture

