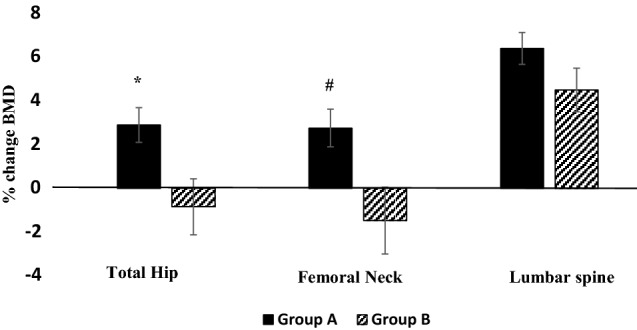
Fig. 2.

Percentage change in BMD at total hip (TH), femoral neck (FN) and lumbar spine (LS) in patients with CKD (Group B) and without CKD (Group A). Error bars denote the SEM. Changes in BMD were significantly lower at the hip sites in patients with GFR < 35 ml/min (Group B). *p = 0.015, #p = 0.025
