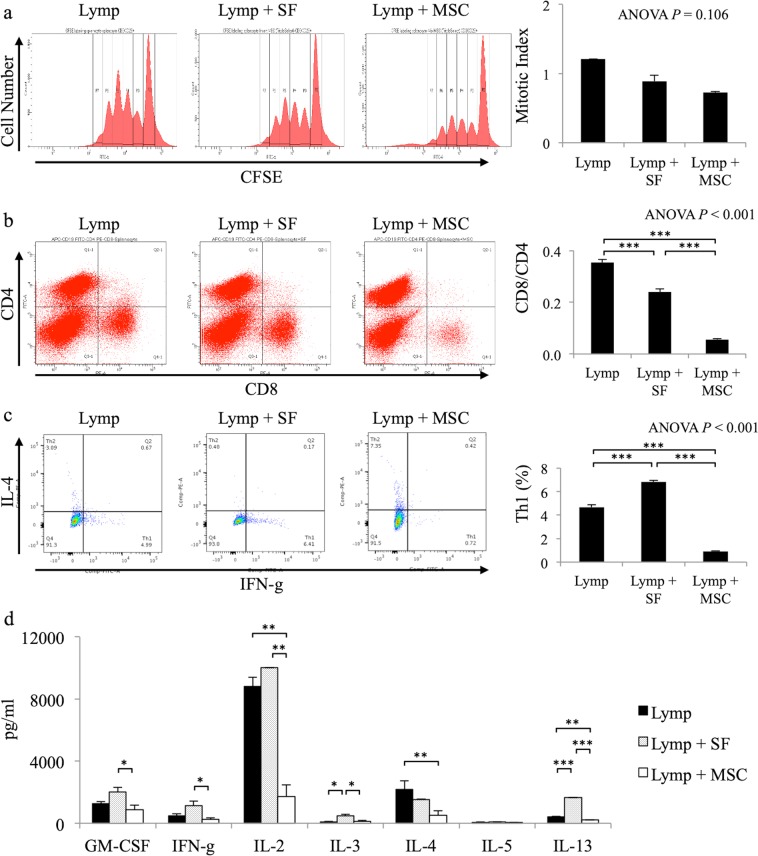
Figure 3.
Direct effect of mesenchymal stem cells (MSCs) on lymphocytes. (a) Representative mixed lymphocyte reaction data for lymphocyte (lymp), lymphocyte + soluble factors from MSCs (lymp + SF), and lymphocyte + MSC (lymp + MSC) groups. The graph shows the mitotic index in each group (n = 3, each). (b) Representative flow cytometry data for lymp, lymp + SF, and lymp + MSC groups stained with anti-CD4 and anti-CD8 antibodies. The graph shows the ratio of CD8 + cells to CD4 + cells in each group (n = 3, each); ***P < 0.001. (c) Representative flow cytometry data for lymp, lymp + SF, and lymp + MSC groups stained with anti-CD4, anti-IL-4, and anti-IFN-g antibodies. The graph shows the percentage of IL4-IFG-g + cells among CD4 + cells in each group (n = 3, each); ***P < 0.001. (d) The concentration of cytokines in lymp, lymp + SF, and lymp + MSC groups (n = 3, each); *P < 0.05, **P < 0.01, ***P < 0.001.

