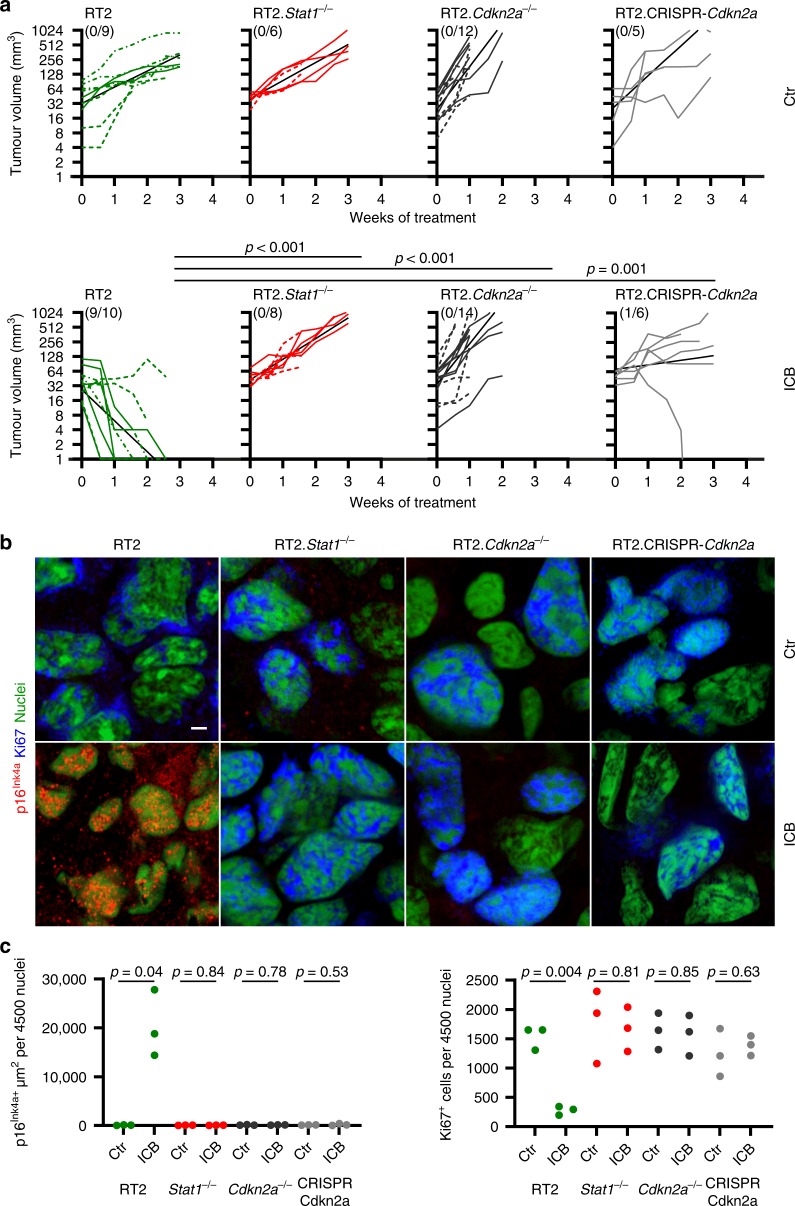
Fig. 1. Stat1- and Cdkn2a-dependent immune control of transplanted RT2-cancers and induction of Ki67−p16Ink4a+ senescent cancer cells.
a Individual follow-up of tumour volumes. CD8-depleted mice were subcutaneously (s.c.) engrafted with 1 × 10⁶ RT2-, RT2.Stat1−/−-, RT2.Cdkn2a−/−- or RT2.CRISPR-Cdkn2a-cancer cells. Treatment with isotype control mAbs (Ctr) or combined immune checkpoint inhibitors (ICB; anti-PD-L1 and anti-LAG-3) once per week was started when tumours were >3 mm in diameter. Cancer size was measured 2 times per week. Number of mice with regressing tumours and the total number of mice is given in parenthesis; RT2 Ctr N = 9, ICB N = 10, RT2.Stat1−/− Ctr N = 6, ICB N = 8, RT2.Cdkn2a−/− Ctr N = 12, ICB N = 14, RT2.CRISPR-Cdkn2a Ctr N = 5, ICB N = 10. Each cell line was given a different lining. Black lines summarise the results for different treatment groups (as obtained from ANCOVA). p-values examine the question whether the treatment effect was different between two genotypes. Mice were killed either when tumours reached the critical diameter of 15–20 mm or ulcerated, or when mice developed signs of wasting. b Representative triple-staining for the senescence marker p16Ink4a (red) and the proliferation marker Ki67 (blue) and for nuclei (green) of the s.c. tumour of individual mice treated as described in (a). Scale bar 2 µm. c Individual data points showing quantification of p16Ink4a+ (left) or Ki67+ (right) cells. Each data point represents the total of three tumour slides measurements, tumours of three individual mice (described in a) were analysed. In a significance was tested by using unequal variances t-test, p-values examines the treatment effect, comparing the ICB-treated RT2-cancers with each ICB-treated knock-out group.

