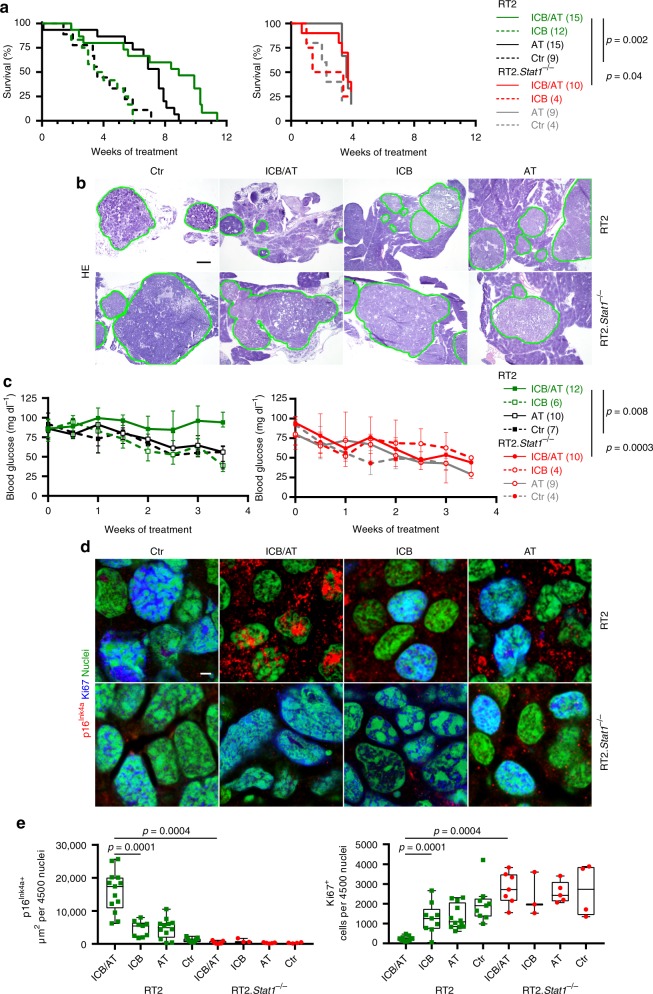
Fig. 4. Stat1-dependent immune control of endogenous RT2-cancers and induction of Ki67−p16Ink4a+ senescent cancer cells.
a Survival curves of RT2 or RT2.Stat1−/− mice treated with either isotype control mAbs (Ctr, RT2 N = 9, RT2.Stat1−/− N = 4), with adoptive transfer of T antigen-specific CD4+ TH1 cells (AT, RT2 N = 15, RT2.Stat1−/− N = 9), with immune checkpoint inhibitors (ICB, RT2 N = 12, RT2.Stat1−/− N = 4; anti-PD-L1 and anti-LAG-3) or with ICB/AT (RT2 N = 15, RT2.Stat1−/− N = 10). For each AT experiment we generated a non-cytotoxic Tag-specific TH1 cell line. b Cancer size shown by representative hematoxylin and eosin staining of pancreas of RT2 (upper panel) or RT2.Stat1−/− mice (lower panel) after four weeks of treatment. Mice were treated as described in a. Green lines depict the size of RT2-cancers after treatment. After 4 weeks of treatment ICB/AT-treated mice (N = 6) had a two-fold smaller islet size than Ctr (N = 7). c Time course of blood glucose levels as surrogate marker for the growth of the insulin-producing tumours of RT2 or RT2.Stat1−/− mice (median ± interquartile range) treated as described in (a Ctr, RT2 N = 7, RT2.Stat1−/− N = 4; AT, RT2 N = 10, RT2.Stat1−/− N = 9; ICB, RT2 N = 6, RT2.Stat1−/− N = 4, ICB/AT, RT2 N = 12, RT2.Stat1−/− N = 10). The mice were sacrificed after 4 weeks of treatment for ex vivo analysis. d, e Representative triple-staining for the senescence marker p16Ink4a (red) and the proliferation marker Ki67 (blue) and for nuclei (green) (d), e showing quantification of p16Ink4a+ (left) or Ki67+ (right) cancer cells of individual mice, treated as described in a, each data point represents the total of three tumour slides measurements (Ctr, RT2 N = 9, RT2.Stat1−/− N = 4; AT, RT2 N = 12, RT2.Stat1−/− N = 5; ICB, RT2 N = 9, RT2.Stat1−/− N = 3, ICB/AT, RT2 N = 13, RT2.Stat1−/− N = 7), box plots show the median with 25th and 75th interquartile range (IQR), and whiskers indicate 1.5 × IQR. Significance tested by using Log Rank test (a, left), Fishers exact test (a, right), or two-tailed Mann-Whitney test (c, e). RT2.Stat1−/− mice have been censored after 3.7 weeks of treatment. Scale bars 200 µm (b) or 2 µm (d). Number of mice is given in parenthesis.

