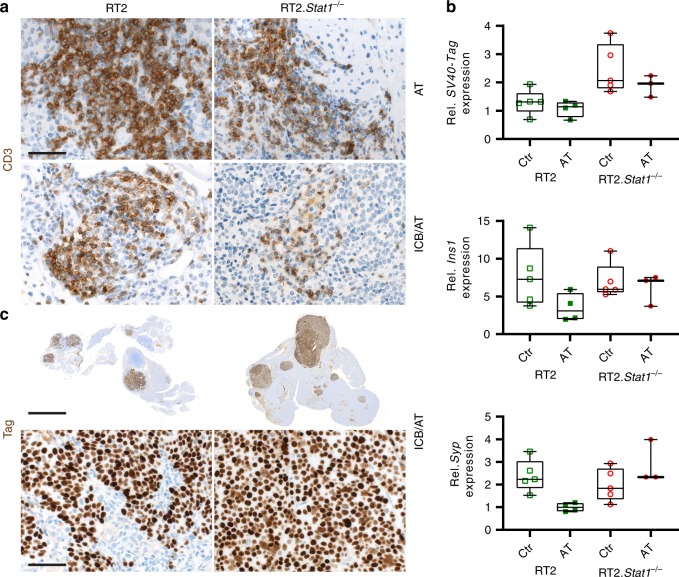
Fig. 5. Infiltration of either RT2 or RT2.Stat1−/− cancers by CD3+ T cells, mRNA expression of tumour associated antigens (TAA) and protein expression of the SV40-Tag tumour antigen recognised by the transferred TAA-specific TH1 cells.
a Representative CD3 immune histochemistry images of RT2-cancers from either RT2 or RT2.Stat1−/− mice treated with adoptive transfer of T antigen-specific CD4+ TH1 cells (AT) or immune checkpoint blockade combined with AT (ICB/AT), scale bar 20 µm. b Relative expression of SV40-Tag, insulin (Ins1) or of synaptophysin (Syp) in single tumours isolated from RT2 or RT2.Stat1−/− mice after control (Ctr) treatment with NaCl or AT. Gene expression was analysed using Actb and Eef1a1 as references. Each point represents one tumour from one mouse (Ctr, RT2 N = 5, RT2.Stat1−/− N = 5; AT, RT2 N = 4, RT2.Stat1−/− N = 3), box plots show the median with 25th and 75th interquartile range (IQR), and whiskers indicate 1.5 × IQR. c SV40-Tag immune histochemistry images of RT2-cancers were from either RT2 or RT2.Stat1−/− mice after ICB/AT therapy. Scale bar upper panel 400 µm, lower panel 20 µm.

