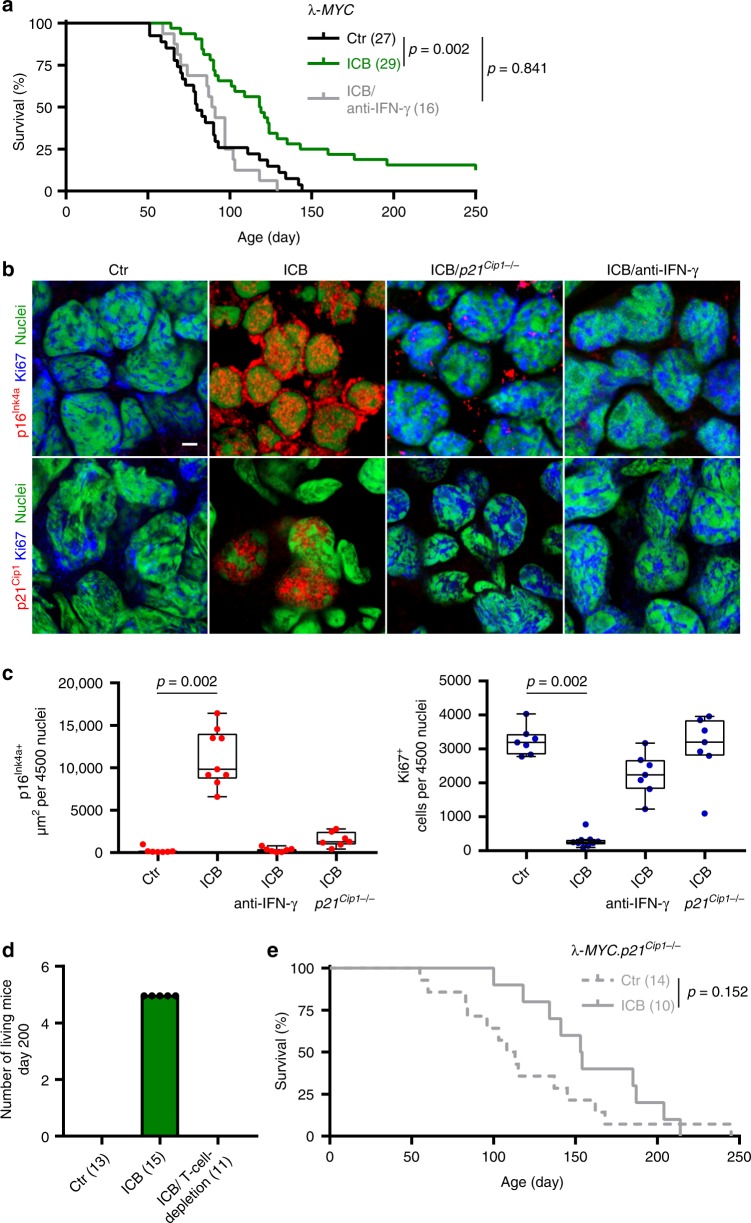
Fig. 8. IFN-γ and p21Cip1-dependent immune control of λ-MYC-induced lymphomas by ICB therapy.
a Survival curves of control (Ctr N = 27), or immune checkpoint inhibitor (ICB; anti-CTLA-4 and anti-PD-1 N = 29) treated λ-MYC mice, or of λ-MYC mice treated with ICB and anti-IFN-γ (N = 16). b, c Triple-staining for the senescence marker p16Ink4a (red, upper panel) or p21Cip1 (red, lower panel), the proliferation marker Ki67 (blue), and for nuclei (green); scale bar 2 µm; representative pictures from Fig. 8c (b). Box plots with individual data points representing p16Ink4a+ (c, left) or Ki67+ nuclei (c, right) of B cells from Ctr- (N = 7), ICB- (N = 9), ICB and anti-IFN-γ-treated λ-MYC mice (N = 7), or ICB-treated λ-MYC.p21Cip1−/− mice (N = 7). Lymph nodes were isolated at similar ages. Each point represents triplicates from one mouse, box plot show the median with 25th and 75th interquartile range (IQR), and whiskers indicate 1.5 × IQR. d λ-MYC mice from the individual treatment groups living at day 200, Ctr N = 13, ICB N = 15, ICB and T-cell-depletion N = 11. e Survival curves of either control (Ctr, N = 14) or ICB-treated λ-MYC.p21Cip1−/− mice (N = 10). Significance tested by using Log Rank test (a, e), two-tailed Mann-Whitney test (c).

