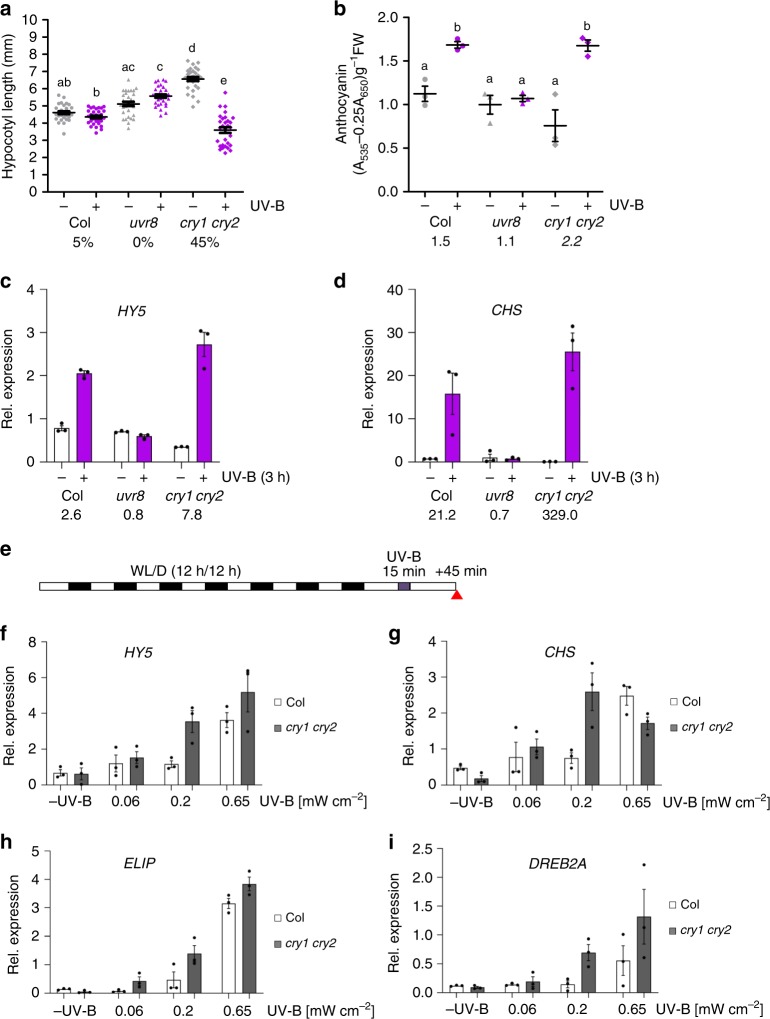
Fig. 4. cry1 and cry2 repress UVR8-mediated UV-B responses.
a Quantification of hypocotyl length in 4-d-old wild type (Col), uvr8-6 (uvr8), and cry1-304 cry2-1 (cry1 cry2) seedlings grown in white light (3.6 μmol m−2 s−1) supplemented with UV-B (+UV-B; 0.015 mW cm−2) or not (−UV-B). Data are means ± SD (N = 30). Shared letters indicate no statistically significant difference in the means (P > 0.05; one-way ANOVA followed by post-hoc Tukey test). Numbers below bars show the relative hypocotyl growth inhibition by UV-B as a percentage. b Quantification of anthocyanin accumulation. Data are means ± SEM (N = 3). Numbers below bars show the fold change values under +UV-B compared with that under −UV-B. c, d qRT-PCR analysis of c HY5 and d CHS mRNA levels in 4-d-old Col, uvr8, and cry1 cry2 seedlings grown in white light and exposed to UV-B at 0.06 mW cm−2 for 3 h (+) or not (−). Data are means ± SEM (N = 3); wild-type Col grown in white light without UV-B was set = 1. Numbers below bars show the fold change values under +UV-B compared with that under −UV-B for each genotype. e A schematic representation of the irradiation conditions. Seven-d-old seedling grown under 12-h light (WL)/12-h dark (D) cycles were irradiated for 15 min with broadband UV-B at different intensities (0.06, 0.20, and 0.65 mW cm−2) or not (−UV). The red arrow indicates when plant samples were harvested 45 min following the UV-B treatment; see also ref. 12. f−i qRT-PCR analysis of f HY5, g CHS, h ELIP2, and i DREB2A in Col and cry1 cry2 seedlings grown as per the schematic in panel (e). Data are means ± SEM (N = 3).

