Figure 1.
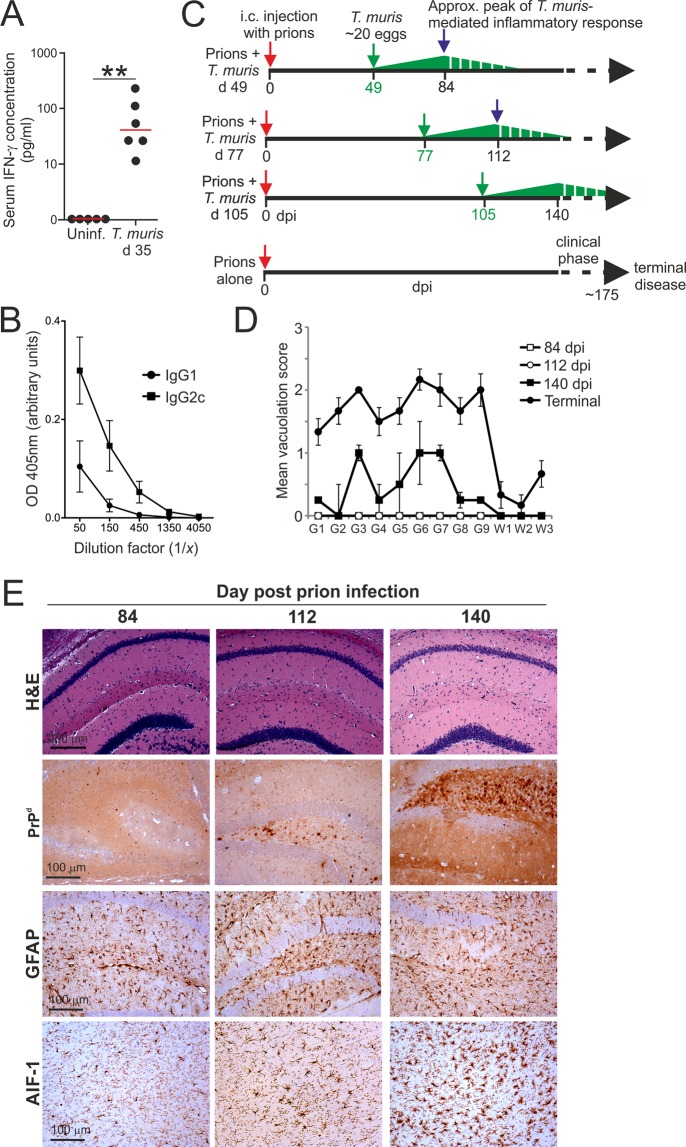
Experimental Design. (A,B) Mice were orally infected with a low dose of T. muris infective eggs (~20/mouse) and serum collected 35 d later. (A) Comparison of IFN-γ concentrations in the serum of T. muris infected mice and uninfected (uninf.) control mice. Each point represents data from an individual mouse (n = 5–6 mice/group). **P < 0.01, Student’s t-test. Horizontal bars, median. (B) Analysis of T. muris E/S antigen-specific IgG1 (closed circles) and IgG2c (closed squares) levels in the sera of T. muris infected mice. Each point represents the mean OD 405 nm ± SEM, n = 3 mice/group. (C) Experiment design. Cartoon shows the relative timings of the individual oral T. muris infections in relation to the ongoing prion infection in the CNS. Dpi, d post IC prion infection; green arrows, d on which mice were orally infected with a single low dose of T. muris. The green triangles represent the relative magnitude of the T. muris-specific immune response, with the peak response occurring by ~35 d and gradually declining afterwards. (D,E) Mice were injected IC with ME7 scrapie prions directly into the CNS and 84, 112 and 140 d later brains were collected and the neuropathology compared by histopathology. (D) The severity of the spongiform pathology (vacuolation) within each brain was scored on a scale of 1–5 in nine grey matter and three white matter areas: G1, dorsal medulla; G2, cerebellar cortex; G3, superior colliculus; G4, hypothalamus; G5, thalamus; G6, hippocampus; G7, septum; G8, retrosplenial and adjacent motor cortex; G9, cingulate and adjacent motor cortex; W1, inferior and middle cerebellar peduncles; W2, decussation of superior cerebellar peduncles; and W3, cerebellar peduncles. Each point represents the mean vacuolation score ± SEM, n = 4 mice/group. Scores from mice with terminal ME7 prion disease are included for comparison. (E) Histopathological comparison of the spongiform pathology (H&E, upper row), PrPd accumulation (brown, second row), reactive astrocytes expressing GFAP (brown, third row) and active microglia expressing AIF-1 (brown, bottom row) in the brains of mice at times indicated after IC injection with prions. Haematoxylin was used as a nuclear counterstain (blue). n = 4 mice/group.

