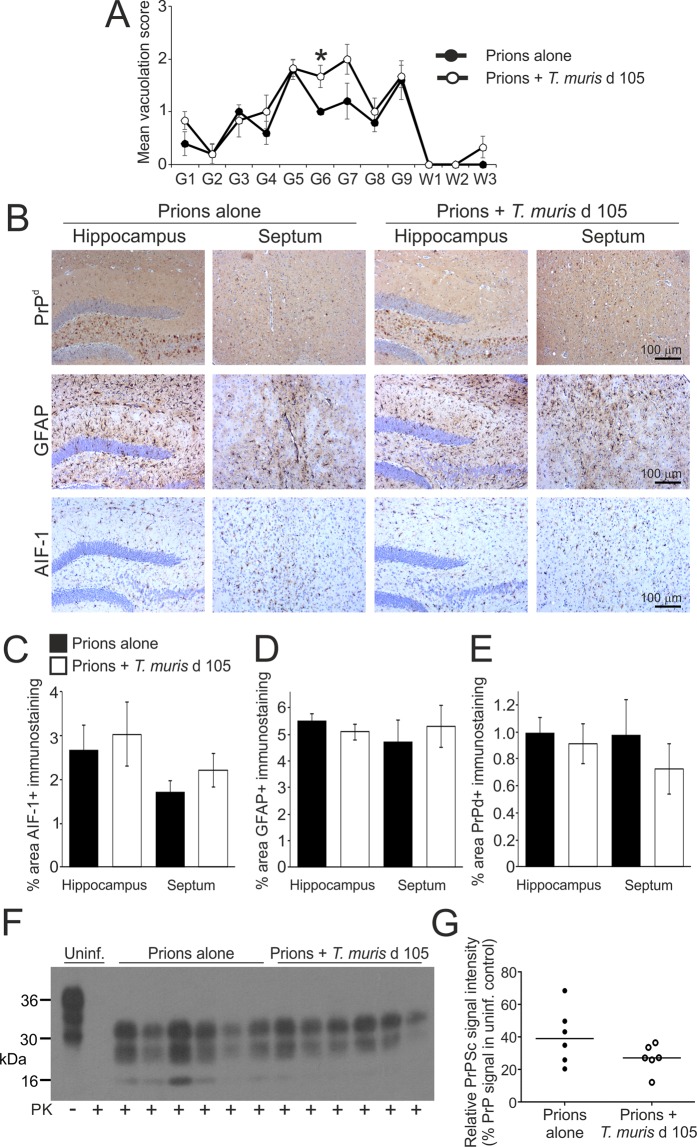
Figure 5.
Effect of co-infection with a low dose of T. muris on the development of neuropathology during the pre-clinical phase of prion disease. Mice were first injected with ME7 scrapie prions directly into the CNS by IC injection and 105 d later they were orally co-infected with a low dose of T. muris infective eggs (~20/mouse). Brains were collected at 140 d after prion infection during the pre-clinical phase of disease and the neuropathology compared. (A) The severity and distribution of the spongiform pathology (vacuolation) within each brain was scored on a scale of 1–5 in nine grey matter and three white matter areas as described in the legend to Fig. 1. Each point represents the mean vacuolation score ± SEM, n = 5–6 mice/group. *P < 0.05, Students t-test. (B) Immunohistochemical analysis of PrPd accumulation (brown, upper row), reactive astrocytes (GFAP+ cells, brown, middle row) and active microglia (AIF-1+ cells, brown, bottom row) in the hippocampus and septum of mice from each group. Haematoxylin was used as a nuclear counterstain (blue). (C–E) Morphometric analysis suggested that the area of the (C) AIF-1+, (D) GFAP+ and (E) PrPd+ immunostaining in the hippocampus and septum was similar in the brains of mice co-infected with T. muris (open bars), when compared to mice infected with prions alone (closed bars). Data represent mean ± SEM, n = 5–6 mice/group, not significantly different to prions alone, Mann-Whitney U test (C) and Student’s t-test (D,E). (F) Immunoblot shows similar levels of proteinase (PK) resistant PrPSc in brains of mice from each treatment group collected at 140 d after prion infection. Uninf., uninfected (control) mice. Three bands are characteristically detected after PK treatment representing the un-glycosylated, mono-glycosylated, and di-glycosylated isomers of PrPSc. (G) Densitometric comparison of PrPSc detected by immunoblot in brains of mice infected with prions alone or co-infected with prions or T. muris. Data are presented as relative % PrP signal in uninfected control. n = 6 mice/group, not significantly different, Student’s t-test.

