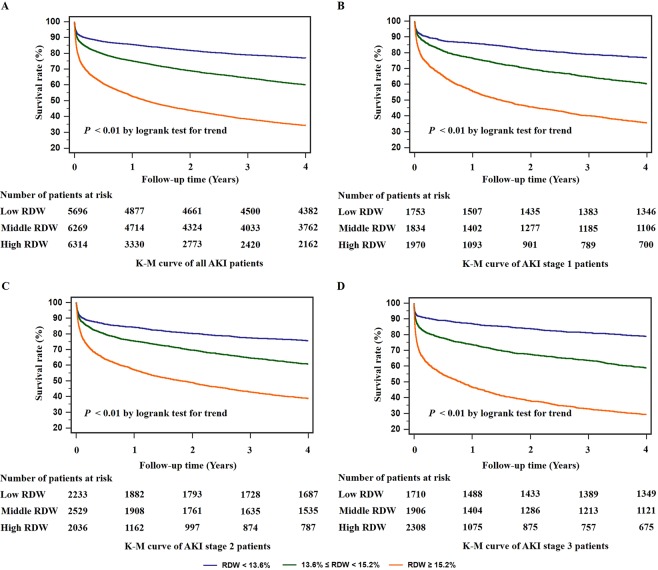
Figure 3.
Kaplan-Meier (K-M) survival curves for 4-year all-cause mortalities of critically ill patients with acute kidney injury (AKI). The risk of 4-year overall mortality of each red blood cell distribution width (RDW) group in all participants was shown (A). Patients with RDW ≥ 15.2% had the highest all-cause mortality. In subgroup analysis, the same changes of the Kaplan-Meier curves were observed at AKI stage 1 (B), stage 2 (C) and stage 3 (D).

