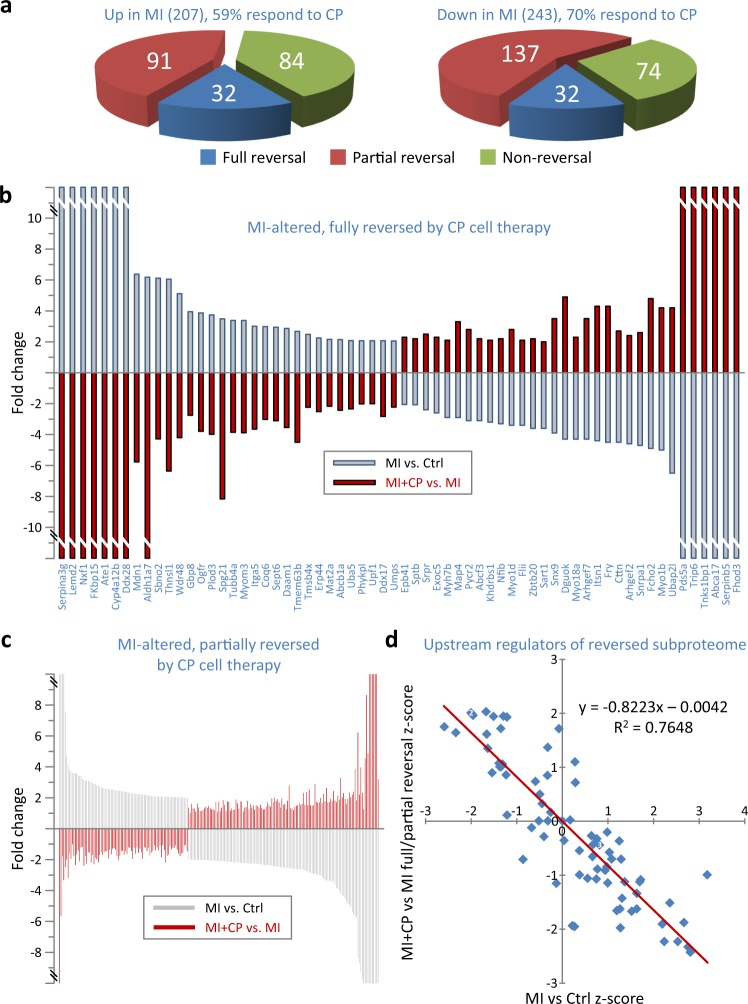
Fig. 2. Reversal of infarcted proteome and predicted upstream regulators.
a A majority of proteins altered by MI responded to cardiopoietic (CP) cell therapy (n = 292, 64.9%), either by full (n = 64, 14.2%, blue) or partial (n = 228, 50.7%, red) reversal, whereas 158 proteins (35.1%, green) did not. A larger proportion of downregulated (70%) than upregulated (59%) proteins were responsive to therapy. b Full reversal, following cell treatment, occurred for 32 proteins upregulated and 32 downregulated by infarction. Proteins altered in MI vs. Ctrl (gray bars) were considered fully reversed when altered in the opposite direction in MI + CP vs. MI (red bars) such that MI + CP did not differ from Ctrl. c Partial reversal occurred for 91 proteins upregulated and 137 downregulated by infarction. Proteins considered partially reversed were altered in the opposite direction in MI + CP (versus MI), and either without reaching significance versus MI and not differing from Ctrl; or significantly differing from both Ctrl and MI. d Reversed subproteome (n = 292 proteins) interpretation by pathway analysis identified 78 upstream regulators possessing z-scores for both infarction-induced (MI versus Ctrl) and reversed (MI + CP versus MI) proteome changes, with large z-scores predictive of activation (positive z-score) or inhibition (negative z-score). z-score inverse correlation suggested upstream regulators activated by MI were inhibited by cell therapy, and vice versa. Several cardiac and stem cell transcription factors localize to the upper left quadrant, indicating predicted inhibition in MI, with re-activation upon CP cell therapy. Ctrl control, MI myocardial infarction, MI + CP MI plus cardiopoietic cell therapy.

