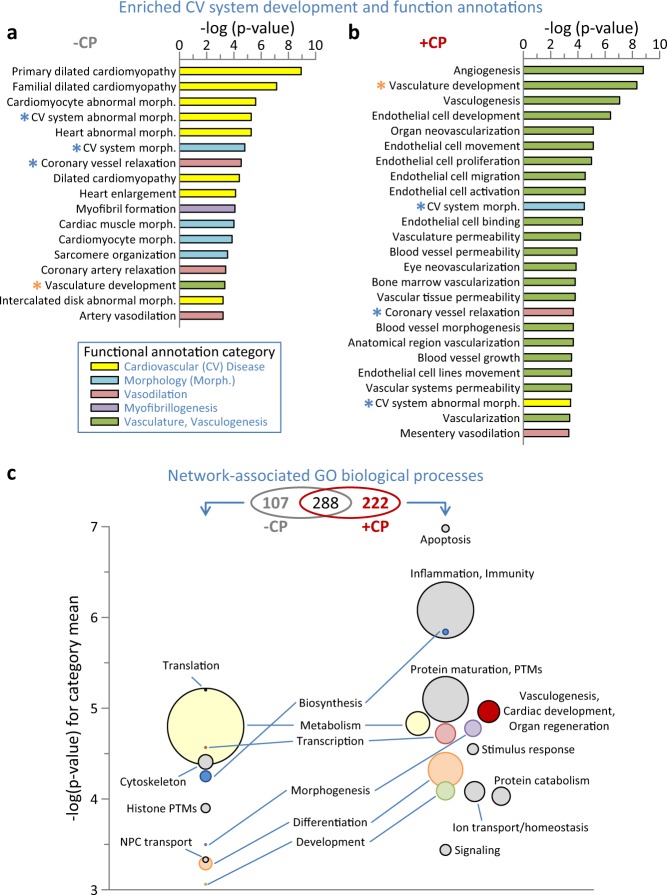
Fig. 4. Functional enrichment at proteome and network levels indicative of cell therapy impact.
a Screening of proteins differentially expressed by myocardial infarction (–CP) for Ingenuity Pathway Analysis (IPA) enrichment (p < 0.001) of cardiovascular system development and physiological functions revealed prioritization of cardiovascular disease and abnormal morphology. b IPA screening of the cell therapy differential proteome (+CP) indicated a transition from infarction, with numerous enriched functions prioritizing vasculogenesis and associated vascular properties. Asterisks indicate annotations common to a and b, shown in blue or orange if reduced or increased in significance, respectively, following cell therapy (+CP versus –CP). c Venn diagram indicates enriched (Benjamini–Hochberg corrected p < 0.001) Gene Ontology (GO) Biological Processes shared between or unique to the –CP and +CP networks from Supplementary Data Fig. 2. Bubble plots indicate processes unique to each network, with circle diameter proportional to intra-cluster number of annotations, and −log(p-value) for each circle representing the mean of all annotations represented within the cluster. Clusters present in both networks are noted between the –CP and +CP bubble plots, with matching categories shown in identical colors.

