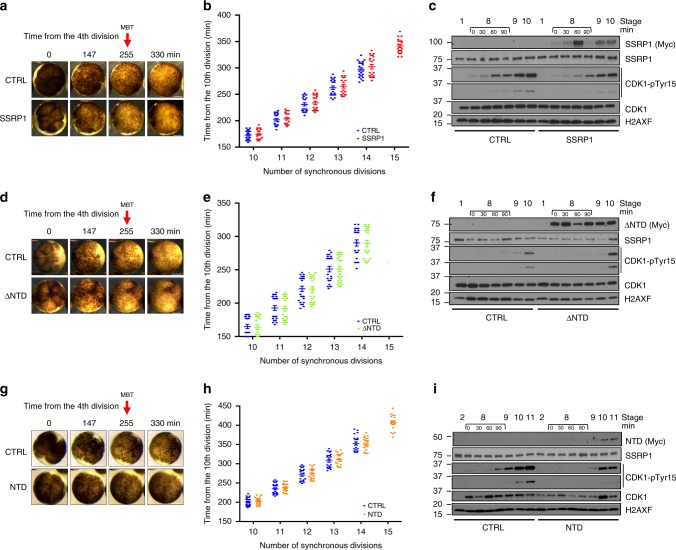
Fig. 6. SSRP1 induced delay of MBT onset.
a Time lapse video frames taken from movie S1 at the indicated times from the 4th cleavage (set as time zero) of embryos injected at the one-cell stage. Top row: control buffer (CTRL) injected embryos; Bottom row: embryos injected with Myc-SSRP1 mRNA. Size bar = 500 μm. b Graph showing the number of synchronous divisions-only of 24 embryos injected with Myc-SSRP1 mRNA or buffer and monitored up to 450 min from fertilization. Only cleavages after the 10th are shown to simplify graph layout. Each dot represents one embryo. Bars show mean ± SEM. c WB using the indicated antibodies of whole embryos injected with Myc-SSRP1 mRNA or buffer and taken at the indicated stages. Stage 8 was sampled every 30 min. d Images taken as in (a) from time-lapse movie S2. Embryos injected with control buffer or Myc-∆NTD mRNA. Size bar = 500 μm. e Graph showing the number of synchronous divisions monitored as in (b) of embryos injected with buffer or Myc-∆NTD mRNA. f WB of whole embryos injected with Myc-∆NTD mRNA or buffer and taken as in (c). g Images taken as in (a) from time-lapse movie S3 of embryos injected with control buffer or NTD mRNA. Size bar = 500 μm. h Graph showing the number of synchronous divisions monitored as in (b) of embryos injected with control buffer or Myc-NTD mRNA. i WB of whole embryos injected with control buffer or Myc-NTD mRNA taken as in (c).

