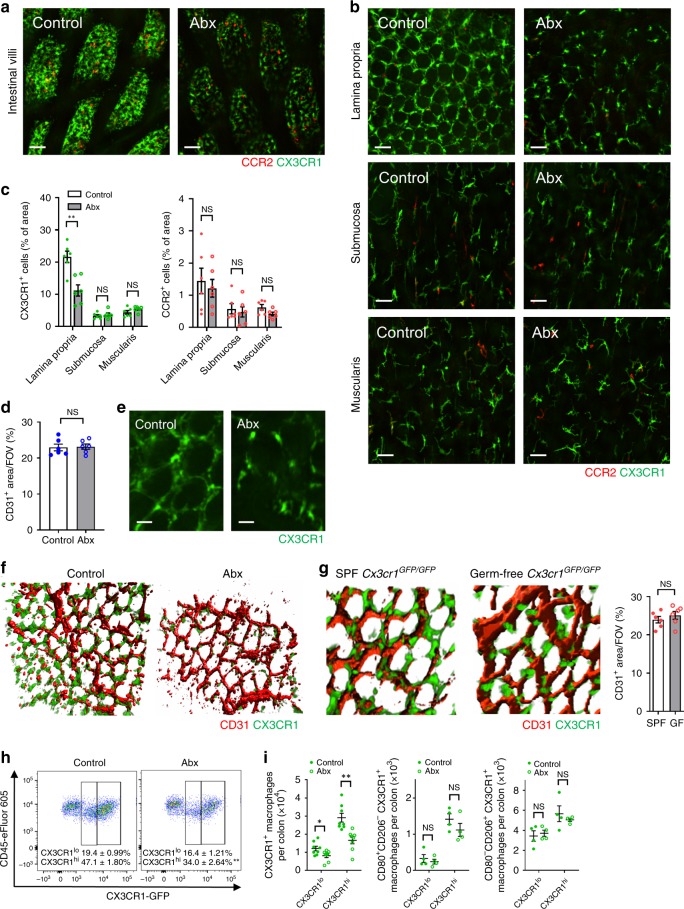
Fig. 3. Gut microbiota affects the distribution and morphology of intestinal CX3CR1+ macrophages.
Representative images of a small intestinal villi and b colonic lamina propria (LP), submucosa and muscularis in Cx3cr1GFP/+Ccr2RFP/+ mice (The left column is SPF control, the right column is Abx-treated mice). Scale bars, 50 μm. c Quantification of CX3CR1+ cells or CCR2+ cells per field of view (FOV) in each layer of the colon in control and Abx-treated mice. n = 6 per group. d Quantification of CD31+ area per FOV in colonic LP in control and Abx-treated mice. n = 6 per group. e Representative high-magnification and f 3D reconstructed images of CX3CR1+ macrophages and vasculature in LP. Scale bars, 20 μm. g Representative 3D reconstructed images of CX3CR1+ macrophages in LP in control and germ-free Cx3cr1GFP/GFP mice. Quantification of CD31+ area per FOV in colonic LP in control and germ-free mice (right). n = 6 per group. h Flow cytometry analysis of the proportion of CX3CR1int and CX3CR1hi macrophages in the colonic LP in control and Abx-treated mice at steady state. Cells were pregated on size, viability, CD45+, CD103−, CD11b+, and F4/80+. i Absolute number of CX3CR1+, CD80+CD206−, and CD80−CD206+ macrophages in the total colon of control and Abx-treated mice. Cells were pregated on size, viability, CD45+, CD103−, CD11b+, and F4/80+. n = 4–8 per group. Data represent mean ± SEM. *p < 0.05, **p < 0.01, NS, not significant. Source data are provided as a Source Data file.

