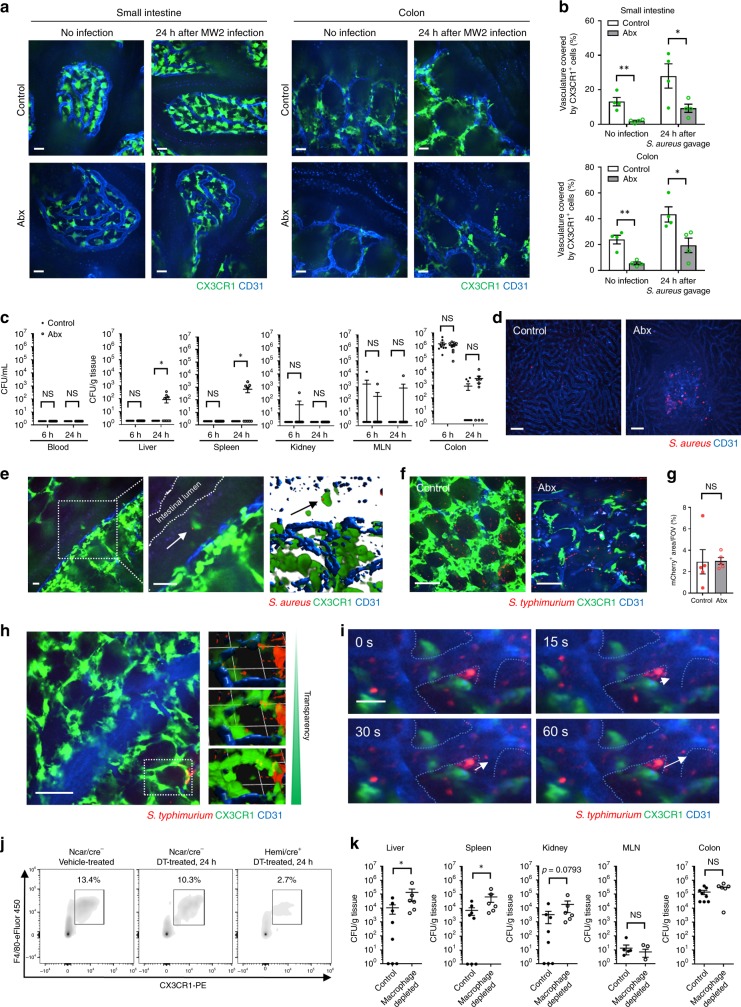
Fig. 5. CX3CR1+ macrophages in intestinal lamina propria of antibiotic-treated mice do not cover the vasculature and result in bacterial dissemination.
a Representative images of small intestinal villi and colonic lamina propria in control and Abx-treated Cx3cr1GFP/+ mice at 24 h after the gavage of S. aureus MW2. Scale bars, 20 μm. b Quantification of area of vasculature covered by CX3CR1+ macrophages in control and Abx-treated Cx3cr1GFP/+ mice with or without S. aureus infection. c CFU counts at 6 and 24 h after S. aureus MW2 gavage in control and Abx-treated mice. n = 9–10 per group. d Still image of the liver in control and Abx-treated mice at 24 h after gavage of mCherry-MW2. Scale bars, 50 μm. e Representative images of CX3CR1+ macrophage (green) catching S. aureus (red) in colonic epithelium at 24 h after the gavage of S. aureus mCherry-MW2. Higher magnification of the indicated area was shown in middle and 3D image was shown in right. Arrows indicate S. aureus. Scale bars, 20 μm. f Representative images of colonic lamina propria in control and Abx-treated Cx3cr1GFP/+ mice at 6 hrs after the intraluminal injection of mCherry-Salmonella typhimurium. Scale bars, 50 μm. g Quantification of mCherry+ area in control and Abx-treated Cx3cr1GFP/+ mice. h Images (right; 3D reconstruction) of mCherry-S. typhimurium caught by intestinal CX3CR1+ macrophages in SPF control mice. Transparency adjustment was applied (upper) to allow for visualization of S. typhimurium inside CX3CR1+ macrophages. Scale bar, 50 μm. 1 Unit = 23.3 μm. i Time-lapse images of colonic lamina propria in Abx-treated Cx3cr1GFP/+ mice at 6 h after the intraluminal injection of mCherry-S. typhimurium. White arrows indicate S. typhimurium disseminating to blood flow. Blue dotted lines indicate CD31+ vasculature. Scale bar, 20 μm. j Flow cytometry analysis of the proportion of CX3CR1+ macrophages in the colonic LP in Csf1rLsL-DTR/LysMcre mice with or without diphtheria toxin treatment. Cells were pregated on size, viability, and CD45+. k CFU counts at 24 h after S. typhimurium (1 × 10⁹ CFU) gavage in control and macrophage-depleted mice. n = 6−8 per group. Data were pooled from two independent experiments. Data represent mean ± SEM. *p < 0.05, **p < 0.01, NS not significant. Source data are provided as a Source Data file.

