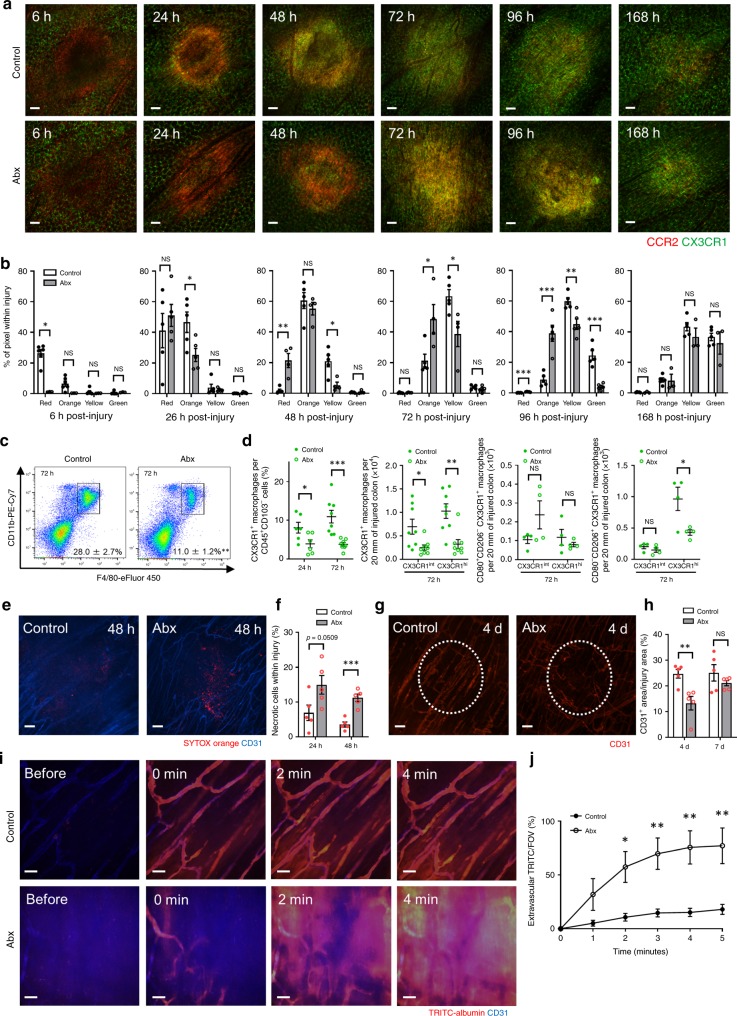
Fig. 7. Gut microbiota is involved in the intestinal repair process by regulating the conversion of monocytes.
a Representative images taken from 6 to 168 h after focal intestinal injury and b quantification of their monocyte hues within injury in control or Abx-treated Cx3cr1GFP/+Ccr2RFP/+ mice. Scale bars, 100 μm. n = 4–6 per group. c Flow cytometry analysis and d quantification of the proportion and number of CX3CR1+ macrophages (total, CD80+CD206−, or CD80−CD206+) in injured colon isolated from control and Abx-treated mice at indicated time points after burn injury. Cells were pregated on size, viability, CD45+, CD103−, CD11b+, and F4/80+. Data are representative of three independent experiments. n = 4–8 per group. e Representative images of necrotic cells (SYTOX orange, red) within injury at 48 h post injury. Scale bars, 100 μm. f Quantification of SYTOX orange+ area within injury at 24 and 48 h post injury in control and Abx-treated mice. n = 5 per group. g Representative images of injury site 4 days post injury in control and Abx-treated mice. Mice were administered anti-CD31 (red) antibody intravenously to visualize vasculature. White dashed line highlights original injury border. Scale bars, 100 μm. h Quantification of revascularization (CD31+ area within injury) at indicated time points in control and Abx-treated mice. n = 5 per group. i Representative images of intestinal injury site 4 days post injury. Time-lapse images were taken before and after intravenous TRITC-albumin (red) administration in control and Abx-treated mice. Scale bars, 50 μm. j Quantification of extravascular (outside of CD31+ vasculature) TRITC+ area/FOV at indicated time points in control and Abx-treated mice. n = 5 per group. Data represent mean ± SEM. *p < 0.05, **p < 0.01, ***p < 0.001, NS not significant. Source data are provided as a Source Data file.

