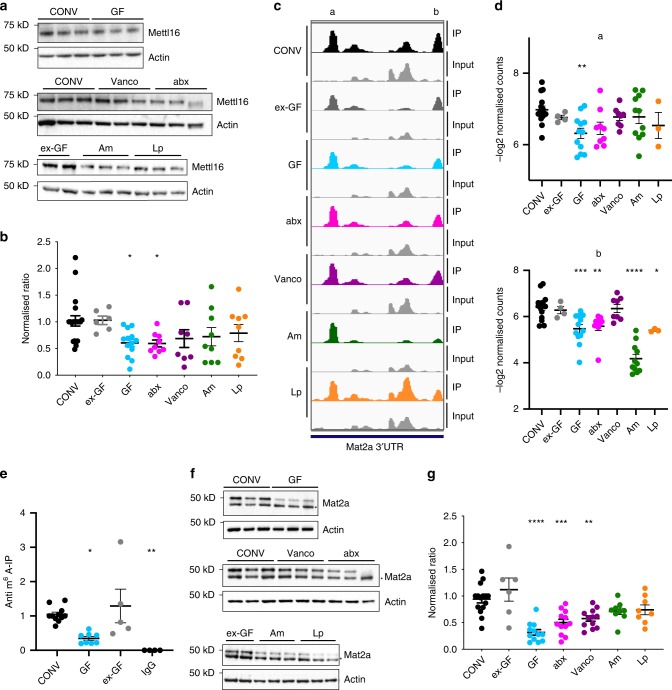
Fig. 4. Differential expression of Mettl16 and Mat2a in mouse cecum.
a Western blot analysis of Mettl16 expression from ceca of CONV, GF, ex-GF, abx, vanco, Am, and Lp mice. Actin served as loading control. The membrane and thus the actin loading control for the blot displaying samples from ex-GF, Am, and Lp mice is identical to the western blot in Supplementary Fig. 4a. b Quantification using six different western blots; CONV n = 20, ex-GF n = 6; GF n = 13; abx n = 9; vanco n = 8; Am n = 9; Lp n = 9; Mettl16/Actin ratio was normalized to ratio in CONV mice in order to compare protein expression across multiple Western Blots. Ordinary one-way ANOVA was performed. *p-value < 0.05; p-values (compared to CONV): ex-GF: 0.9518; GF: 0.0255; abx: 0.0431; vanco: 0.1750; Am: 0.1783; Lp: 0.2728) (Holm–Sidak’s multiple comparisons test). c Representation of two m6A peaks (mean of read per million normalized coverage (RPM) in detected methylation peaks) from anti-m6A immunoprecipitates and input in the 3′UTR of the Mat2a transcript in cecum. The peaks designated a and b were visualized for the indicated mouse models using IGV; d Quantification of indicated Mat2a peaks (a, b from b) as -log2 normalized read counts. Ordinary one-way ANOVA for multiple comparisons was performed. CONV (n = 15), GF (n = 12); ex-GF (n = 4); abx (n = 9); vanco (n = 8); Am (n = 11), Lp (n = 3); two independent sequencing experiments; a p-values (all compared to CONV): ex-GF: 0.6458; GF: 0.0039; abx: 0.0572; vanco: 0.6458; Am: 0.6458; Lp: 0.4695; b p-values (all compared to CONV): ex-GF: 0.889955; GF: 0.000323; abx: 0.003604; vanco: 0.889955; Am: 0.00000000000028; Lp: 0.018424; e anti-m6A-IP and qRT for Mat2a transcript in CONV (n = 11), ex-GF(n = 5) and GF (n = 8) cecal RNA; IgG-IP (n = 4) served as control for unspecific binding; ordinary one-way ANOVA was performed; *p-value < 0.05; ***p-value < 0.005; p-values (compared to CONV): ex-GF: 0.6897; GF: 0.0127; IgG: 0.0029; f Western Blot analysis of Mat2a expression in CONV, GF, ex-GF, abx, vanco, Am, and Lp cecum. Actin served as loading control. Asterisk marks an unspecific band. g Quantification of Mat2a expression in CONV, GF, ex-GF, abx, vanco, Am, and Lp cecum. Quantification was performed using at least three different western blots for each condition; CONV n = 15, ex-GF n = 6; GF n = 12; abx n = 12; vanco n = 12; Am n = 9; Lp n = 9; Mat2a/Actin ratio was normalized to ratio in CONV mice in order to compare protein expression across multiple western blots; ordinary one-way ANOVA was performed. ***<0.0001, **p-value < 0.005 (Holm–Sidak’s multiple comparisons test); p-values (all compared to CONV): ex-GF: 0.157; GF: 0.00000019; abx: 0.0002; vanco: 0.0019; Am: 0.1111; Lp: 0.154; data are presented as mean values ±SEM throughout the figure; details for statistical analysis and original data for a, b, d–g are given in the source data file.

