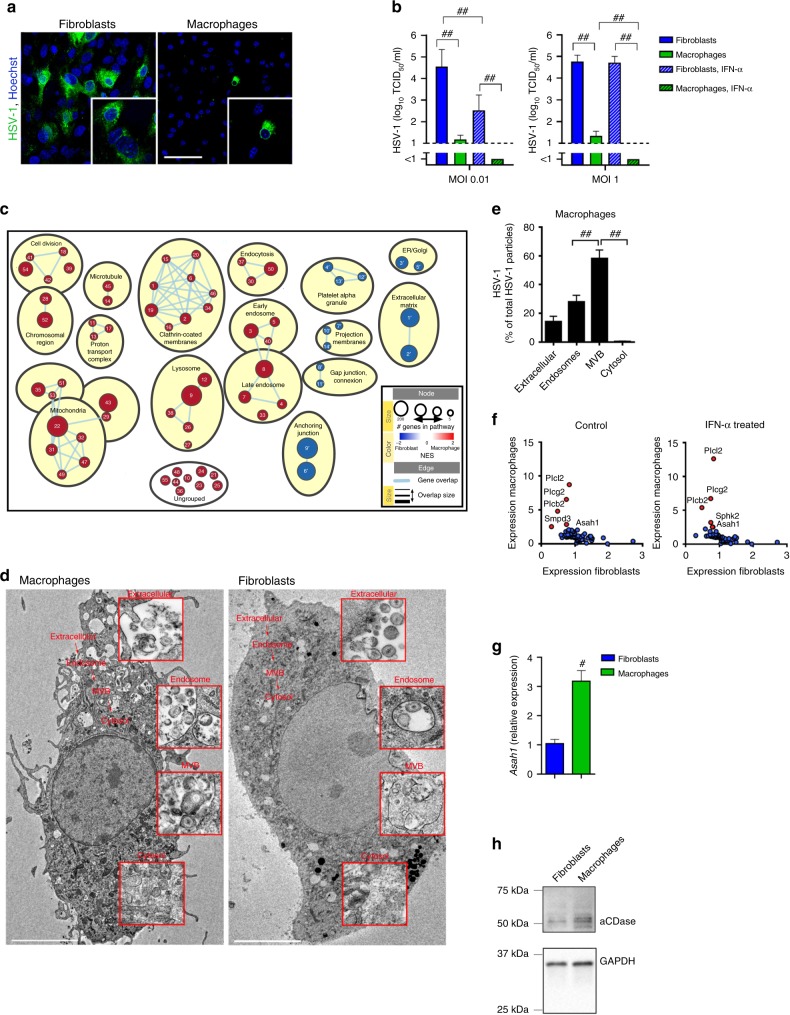
Fig. 2. aCDase in multivesicular bodies traps HSV-1.
a, b Immunofluorescence (a) and tissue culture infection dose 50 (TCID50) from supernatants (b) of fibroblasts or bone marrow derived macrophages (BMDMs) that were infected with herpes simplex virus type 1 (HSV-1) at a multiplicity of infection (MOI) of 10 and stained after 6 h (a, n = 4; scale bar 50 µm) or MOI 0.01 or MOI 1 and supernatant was collected after 24 h (b, n = 8; one-way ANOVA [Tukey’s multiple comparison]). c Gene set enrichment analysis (GSEA) of microarrays showing gene sets enriched in macrophages (red) vs. gene sets enriched in fibroblasts (blue). See Supplementary Table 1a, b for gene sets, ranking and grouping. NES: normalized enrichment score. ER: endoplasmic reticulum. d, e Representative electron microscopic images (d) and quantification (e) of wild-type (WT) BMDMs and/or fibroblasts infected with HSV-1 (MOI 250) analyzed after 30 min (BMDMs: n = 77 images from three independent experiments, scale bar 5 µm; Fibroblasts: n = 106 images from three independent experiments, scale bar 5 µm, one-way ANOVA [Tukey’s multiple comparison]). Overview of one macrophage and one fibroblast is shown. Details show specific compartments containing HSV-1. MVB: multivesicular bodies. f: Expression of membrane-modulating proteins analyzed from microarrays of fibroblasts and macrophages with or without 50 U/ml interferon-α4 (IFN-α4) treatment. g Real-time polymerase chain reaction (RT-PCR) for Asah1 mRNA expression of fibroblasts and macrophages from WT mice (n = 6, two-tailed student’s t-test). h Western Blot for aCDase protein expression of fibroblasts and macrophages from WT mice (1 of 2 is shown). All data are shown as mean ± SEM. *p ≤ 0.05, **p ≤ 0.01, #p ≤ 0.001, ##p ≤ 0.0001.

