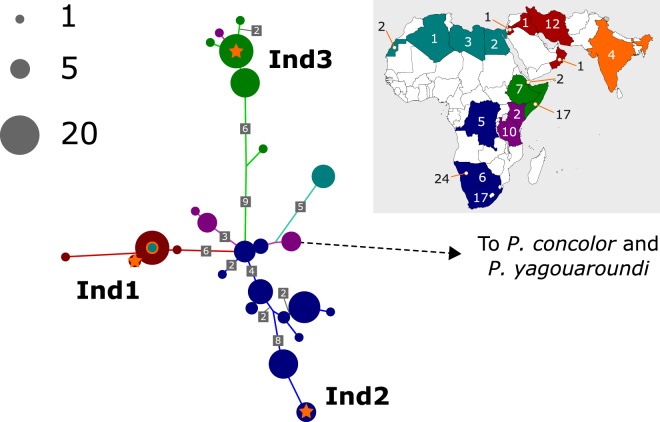
Figure 1.
Tree schematic situating the Indian cheetah mtDNA within a worldwide sample of 121 modern and historic cheetah, based on a maximum likelihood unrooted tree using a concatenated alignment of up to 1238 bp. Colours indicate sampling location, and the numbers of samples from different countries is indicated on the map: green, northeast Africa; teal, northwest Africa; purple, east Africa; blue, southern Africa; dark red, southwest Asian; orange, Indian. These geographic sampling locations correlate strongly with mtDNA subspecies affiliation, though some samples are imports or customs seizures such that ancestral origin is ambiguous. The mtDNA samples presented in this paper (Ind1, Ind2 and Ind3) are indicated on the tree as orange stars. The most probable ancestral state at internal nodes was inferred by maximum likelihood and branches that represent >1 mutation are labelled with the number of mutations. Note that branch length does not always correspond closely with the inferred number of mutations due to varying probability of different mutations according to the mutation model.

