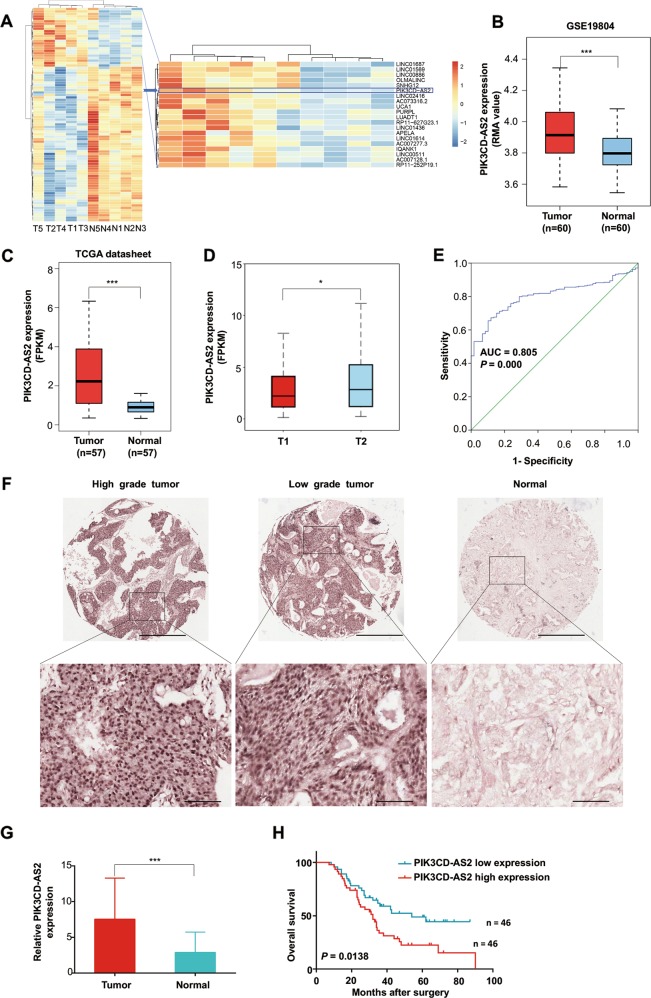
Fig. 1. PIK3CD-AS2 is overexpressed in lung adenocarcinoma cancer (LUAD) and associated with tumor size, histological grade and poor survival.
a Total RNA harvested from human LUAD tumor tissues and matched non-tumor tissues was screened by microarray analysis (fold-change ≥ 2; P ≤ 0.01; n = 5). Left: the cluster heat map classified as differentially expressed lncRNAs. Right: 20 top-ranked upregulated lncRNAs were shown in LUAD tumors. Upregulated (Red) and downregulated (Blue) lncRNAs in LUAD. b, c PIK3CD-AS2 expression in LUAD and normal lung tissues from b GEO data sets GSE19804 normalized using the robust multichip averaging (RMA) values and c TCGA transcriptome profiling represented as FPKM, fragments per kilobase of exon per million fragments mapped reads. Data are presented as median ± 1.5 IQR. P values were determined by t-test. ***P < 0.001 (GEO: n = 60; TCGA: n = 57). d PIK3CD-AS2 expression of early-stage (I–IIa) lung cancer patients in TCGA data was separated by tumor size, and expressed as median ± 1.5 IQR. P value was determined using unpaired t-test. *P < 0.05. e Receiver-operating characteristic (ROC) curve calculated sensitivity and specificity of PIK3CD-AS2 expression level for prediction of LUAD (tumor, n = 513, normal, n = 59, area under ROC curve = 0.805, P = 0.000). f Representative images of in situ hybridization (ISH) of PIK3CD-AS2 in the TMA of 92 LUAD patients samples. Scale bars: 500 μm and 100 μm (insets). g PIK3CD-AS2 expression measured by ISH was scored by pathologists blind to the study design. Data are presented as mean ± SD. P value was determined by paired t-test. ***P < 0.001. h Kaplan–Meier overall survival (OS) analysis of high PIK3CD-AS2 expression and low PIK3CD-AS2 expression in LUAD patients (log rank test, P = 0.0138, n = 92).

