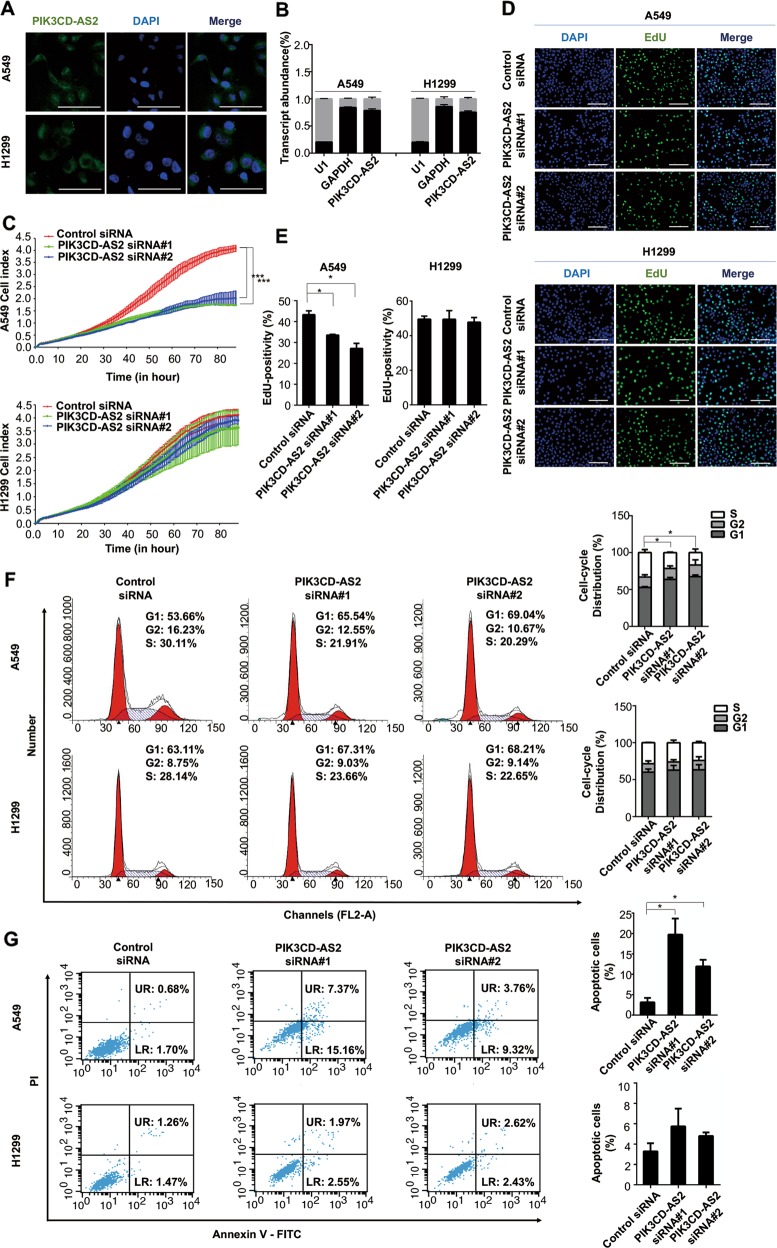
Fig. 2. Depletion of PIK3CD-AS2 abrogates LUAD cell progression in vitro.
a Localization of PIK3CD-AS2 was evaluated by RNA ISH in A549 and H1299 cells. RNA ISH was performed with Dig-labeled probes (green) and nuclei were labeled with DAPI (blue). Scale bars: 50 μm. b Transcript levels of PIK3CD-AS2, U1 (nuclear marker) and GAPDH (cytoplasmic marker) in the nuclear and cytoplasmic fractions obtained from A549 and H1299 cells were quantified by qRT-PCR. c–g A549 and H1299 cells were transfected with PIK3CD-AS2 siRNA or control siRNA, respectively. Twenty-four hours after transfection, 5 × 10³ cells per well were seeded in an E-plate and monitored continuously for 90 h using the xCelligence real-time cell analyzer (RTCA; c). ***P < 0.001 determined by unpaired t-test. Forty-eight hours after transfection, some cells were evaluated by an EdU incorporation assay (d, e). Representative images show proliferation of A549 and H1299 cells labeled with EdU (green) and nuclei stained with DAPI (blue). Scale bars: 50 μm. The proportion of EdU-positive cells in A549 and H1299 cells was quantified. Values represent mean ± SD of three independent experiments. Statistical analysis was carried out using unpaired t test. *P < 0.05; ***P < 0.001. Meanwhile, the effect of PIK3CD-AS2 on phases of cell cycle (f) and apoptosis (g) in A549 and H1299 cells was measured by flow cytometry. Left: representative plots showing the cell cycle distribution or cell apoptosis. Right: percentages of G0, G1, and S phage, or apoptotic cells were calculated, respectively. Values represent mean ± SD of three independent experiments. Statistical analysis was performed using unpaired t-test. *P < 0.05.

