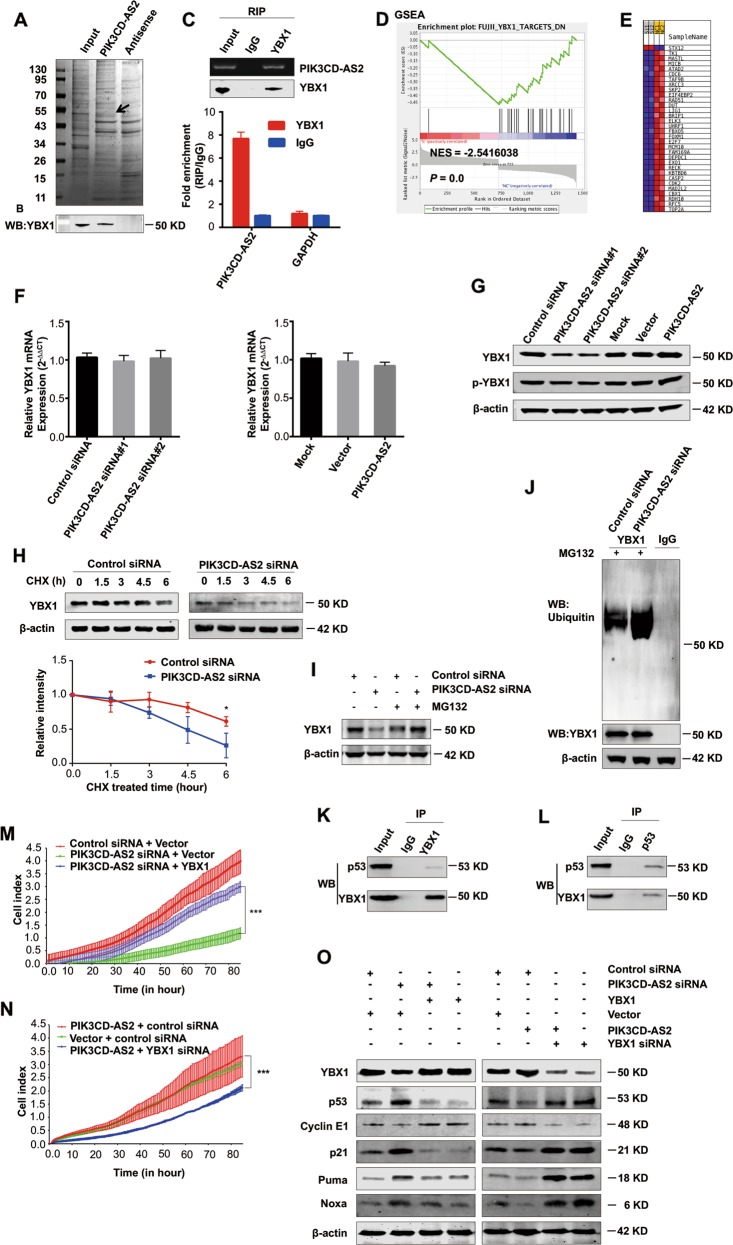
Fig. 6. PIK3CD-AS2 suppresses p53 signaling through directly binding to and stabling YBX1 protein.
a Total lysate from A549 cells was used as a positive control, or pulled down with biotin-labeled PIK3CD-AS2. As a negative control, the cell lysate was incubated with a PIK3CD-AS2 antisense sequence. Representative image of silver-stained PAGE gel showing separated proteins. b Y-box binding protein 1 (YBX1) screened by mass spectrometry (peptide coverage value is 5) was validated using western blot. c qRT-PCR analysis of RNA enrichment in the RIP assay using the YBX1 antibody in A549 cells. Agarose gel of qRT-PCR products for PIK3CD-AS2 (Top). The size of PCR products was ~75 base pair. YBX1 was detected by western blot (Middle). mRNA levels in immunoprecipitated samples, corrected for mRNA levels in input (Bottom). GAPDH was used as negative control for YBX1 binding. d, e GSEA enrichment plots (d) and heat map (e) of differentially expressed genes (data shown in Fig. 4a) belonging to the YBX1 targets with si-PIK3CD-AS2 treatment. The bar-code plot indicates the position of genes on the expression data rank-sorted by its association with PIK3CD-AS2, with red and blue colors indicating overexpression and underexpression in the mRNA. f, g A549 cells were treated as explained in Fig. 4c and harvested for YBX1 expression analysis by qRT-PCR (f) and western blot (g). Values represent mean ± SD of three independent experiments. h–j A549 cells were transfected with PIK3CD-AS2 siRNA or control. Forty-eight hours after transfection, some of cells were treated with cycloheximide (CHX; 10 µg/mL) for 0, 1.5, 3, 4.5 or 6 h, and then measured by western blot (h). Graph shows protein quantification normalized to β-actin (mean ± SD). *P < 0.05 was determined by unpaired t-test. Some of cells were left alone or treated with MG132 (30 µM) for 6 h, and then analyzed for YBX1 expression by western blot (i), and the ubiquitination levels of endogenous YBX1 using immunoprecipitation assay (j). k, l Total protein lysate from A549 cells was extracted for immunoprecipitation using anti-YBX1 antibody (k) or anti-p53 antibody (l). m–o A549 cells were transfected with PIK3CD-AS2 siRNA, PIK3CD-AS2 plasmid or control, respectively. Some cells were also cotransfected with YBX1 siRNA or YBX1 plasmid. After 24 h of transfection, some cells were seeded as explained in Fig. 2c and monitored by RTCA for 90 h (m, n). ***P < 0.001 determined by unpaired t-test. After 48 h of transfection, the expression of p53 pathway molecules was assessed by western blot (o).

