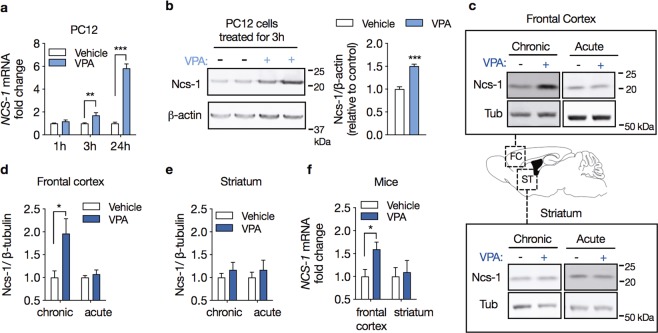
Figure 1.
Valproate induces Ncs-1 expression. (a) Temporal pattern for Ncs-1 mRNA expression in response to 0.62 mM VPA treatment relative to vehicle-treated PC12 cells (n = 3/group). (b) Western blot analysis (left) and densitometry quantification (right) of Ncs-1 protein expression in PC12 cells treated with 0.62 mM VPA or vehicle for 3 h (n = 4/group). (c) Representative western blot analysis of Ncs-1 protein expression in frontal cortex (upper panel) or striatum (lower panel) of mice chronically (25 g of drug per 1 kg of chow for 21 days) or acutely (400 mg/kg i.p. for 3 h) administered with VPA (+) or vehicle (−). The bands of interest were cropped from the same membrane. (d,e) Summary of Ncs-1 protein expression in mouse frontal cortex (d) and striatum (e) after VPA or vehicle treatment (n = 5/group). (f) Ncs-1 mRNA expression following chronic VPA treatment in mouse frontal cortex and striatum relative to vehicle-treated animals (n = 5/group). In all cases data are represented as mean ± SEM. Western blot quantifications were normalized against β-actin or β-tubulin and plotted relative to vehicle-treated samples, which was set to 1. Significant differences were determined by two-way ANOVA followed by Sidak’s multiple comparison tests (a) or Student’s t-tests (b–f). Asterisks (*) in the figures indicate the p-values for the post-hoc test and correspond to the following values: *p < 0.05; **p < 0.01; ***p < 0.001, based upon mean ± standard error of mean.

