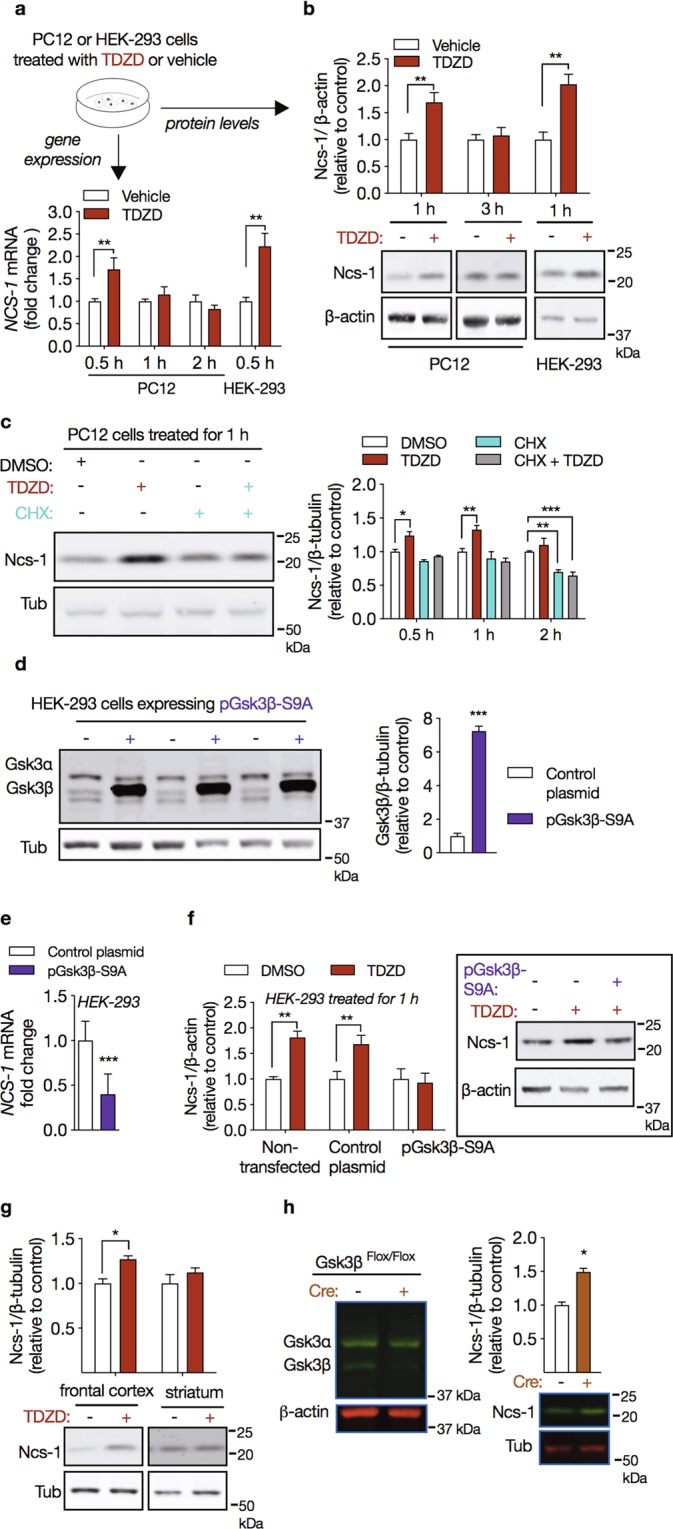
Figure 3.

Gsk3β regulates Ncs-1 expression. (a) Temporal pattern for Ncs-1 gene expression in PC12 or HEK-293 cells treated with the Gsk3 inhibitor TDZD-8 (10 µM) relative to experimental control (DMSO) (n = 4/group). (b) Western blot analysis of Ncs-1 protein expression in PC12 (1 h and 3 h) or HEK-293 cells (1 h) treated with TDZD-8 (10 µM, +) relative to experimental control (DMSO, −) (n = 4/group). The bottom panel shows the representative western blots cropped from the same membrane obtained from these experiments. (c) Representative western blots cropped from the same membrane (left) and densitometry analysis (right) showed that 30 min pretreatment with protein synthesis inhibitor cycloheximide (CHX, 10 μg/ml) blocked TDZD-8-induced Ncs-1 expression (n = 4/group). (d) Representative western blots cropped from the same membrane (left) and densitometry analysis (right) of HEK-293 cells transiently transfected with a plasmid encoding the constitutively active Gsk3β mutant (pGsk3β-S9A, +) or a cloning vector alone (control plasmid, −) (n = 6/group). (e) Overexpression of Gsk3β-S9A decreased NCS-1 mRNA levels (n = 6/group). (f) Overexpression of Gsk3β-S9A also abolished TDZD-8-induced Ncs-1 protein expression (n = 6/group). Control plasmid expressed GFP in the same plasmid backbone used for GSK3beta-S9A expression. The panel in the right shows a representative western blot cropped from the same membrane obtained from this experiment. (g) Ncs-1 protein expression in frontal cortex and striatum of mice administered with TDZD-8 (30 mg/kg i.p. for 1 h, +) or vehicle (−) (n = 5/group). The bottom panel displays representative western blots cropped from the same membrane from these experiments. (h) Representative western blot cropped from the same membrane of Gsk3 isoforms in frontal cortex of Cre-positive (+) or Cre-negative (−) CamKII-Gsk3βFlox/Flox mice. Downregulation of Gsk3β increases Ncs-1 protein expression in the frontal cortex of Cre-positive CamKII-Gsk3βFlox/Flox mice (n = 5/group). The bottom panel shows a representative western blot cropped from the same membrane obtained from this experiment. In all cases data are represented as mean ± SEM. Western blot quantifications were normalized against β-actin (or β-tubulin) and plotted relative to vehicle-treated samples, which was set to 1. Significant differences were determined by Student’s t-tests (HEK-293 data in a,b, d–h) or two-way ANOVA followed by Sidak’s multiple comparison tests (PC12 data in a,b, and c). Asterisks (*) in the figures indicate the p-values for the post-hoc test and correspond to the following values: *p < 0.05; **p < 0.01; ***p < 0.001, based upon mean ± standard error of mean. The drawing in (a) was created with the Keynote software version 9.2.1 (http://apple.com/keynote).
