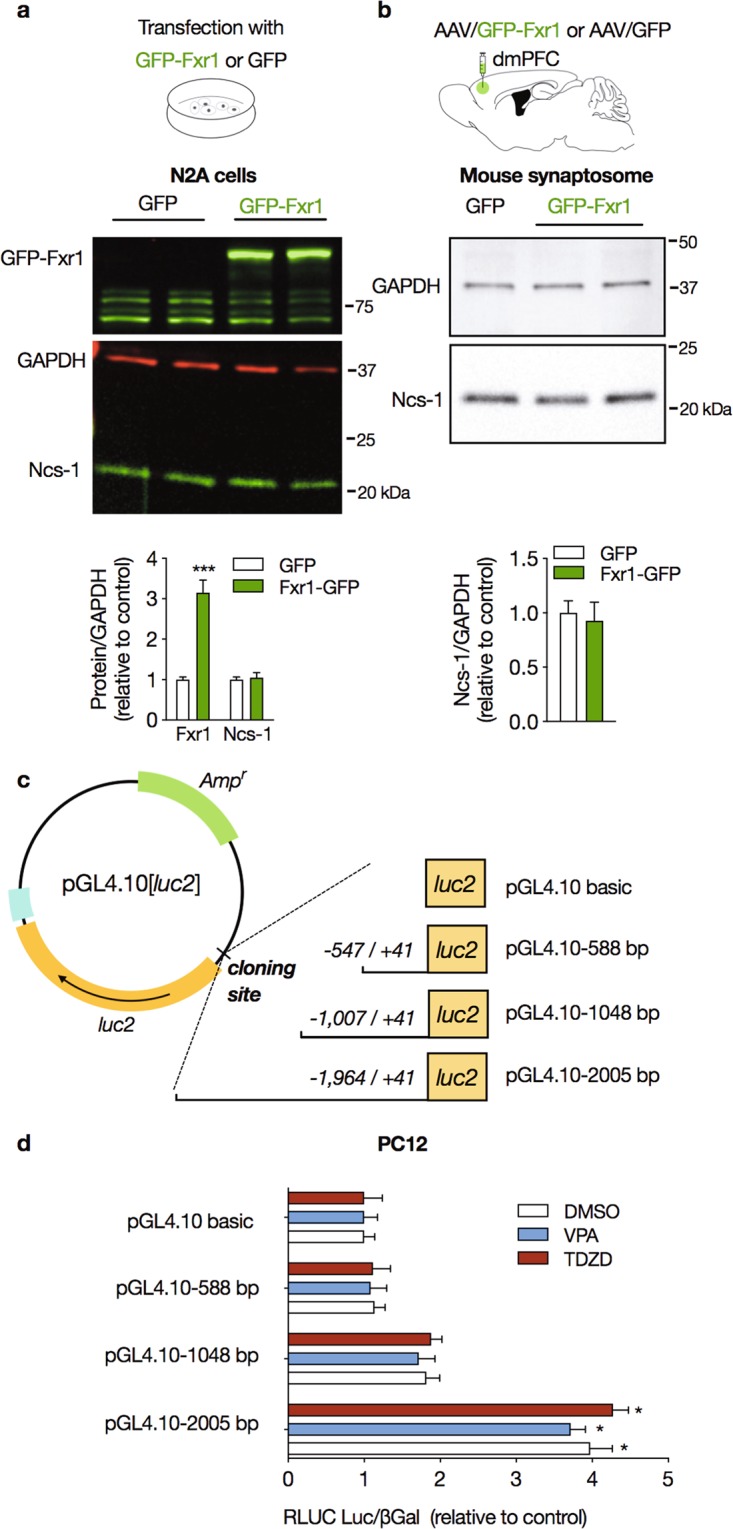
Figure 4.

Effect of Fxr1 on Ncs-1 expression, and activity of NCS-1 gene promoter. (a) Representative western blot (upper panel) and densitometry analysis (lower panel) of Fxr1 and Ncs-1 protein expression following infection with either GFP-Fxr1 or GFP plasmids in N2A cells (n = 4–5/group). (b) Representative western blot cropped from the same membrane (upper panel) and densitometry analysis (lower panel) of Ncs-1 protein expression in purified synaptosome from dorsomedial prefrontal cortex (dmPFC) of mice injected with either AAV/GFP-Fxr1 or AAV/GFP (n = 4–5/group). (c) Schematic representation of the three Ncs-1 reporter constructs (pGL4.10–588, pGL4.10–1048 and pGL4.10–2005) cloned into the pGL4.10[luc2] promoterless vector containing a luciferase (luc2) reporter gene. (d) Luciferase activity was measured in PC12 cells transfected and treated with DMSO (0.001% for 1 or 3 h), VPA (0.625 mM for 3 h) or TDZD-8 (10 µM for 1 h). Relative levels of luciferase activity (RLUC) were normalized by the pGL4.10 cloned with inserts of similar lengths isolated from exon 5 of the CKAMP44 gene, and co-transfection with the pCMV-βgal vector encoding β-galactosidase (see the Supplementary Table S1 for information about the reporter constructs). Luciferase activity was detected only in PC12 cells transfected with pGL4.10–2005. The bars represent the mean ± SEM values of relative luciferase activity from at least four different transfections carried out in triplicate. Significant differences were determined by Student’s t-tests (a,b) or two-way ANOVA followed by Tukey’s multiple comparison tests (c,d). Asterisks (*) in the figures indicate the p-values for the post-hoc test and correspond to the following values: *p < 0.05; **p < 0.01; ***p < 0.001, based upon mean ± standard error of mean. The drawings in (a–c) were created with the Keynote software version 9.2.1 (http://apple.com/keynote).
