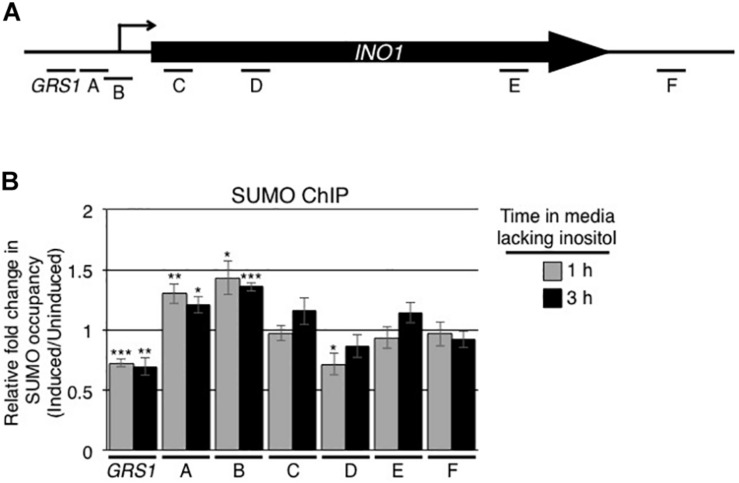
FIGURE 1.
Induction of INO1 leads to changes in the sumoylation of INO1-associated proteins. (A) Diagram of the INO1 locus showing the relative positions of the transcriptional start site (arrow), the GRS1 sequence, the open reading frame, and regions targeted for the ChIP analysis shown in B. (B) WT cells were grown in medium containing inositol (repressing/uninduced conditions) to an OD600 of ∼0.8, washed, and transferred to medium lacking inositol (inducing conditions). Cells were then subjected to ChIP analysis using antibodies directed against the SUMO polypeptide (anti-SUMO antibody) prior to and at 1 and 3 h post induction of INO1. qRT-PCR was used to quantify levels of DNA corresponding to the various regions of INO1 (see A) bound to sumoylated proteins. Shown is the relative fold change in the occupancy of sumoylated proteins associated with the various regions of INO1 at the indicated times after induction relative to the uninduced samples (see section “Materials and Methods”). Results are the means ± SEM of five biological replicates. Asterisks indicate a significant difference relative to uninduced as determined by a Student’s paired t-test. *p < 0.05, **p < 0.01, ***p < 0.001.

