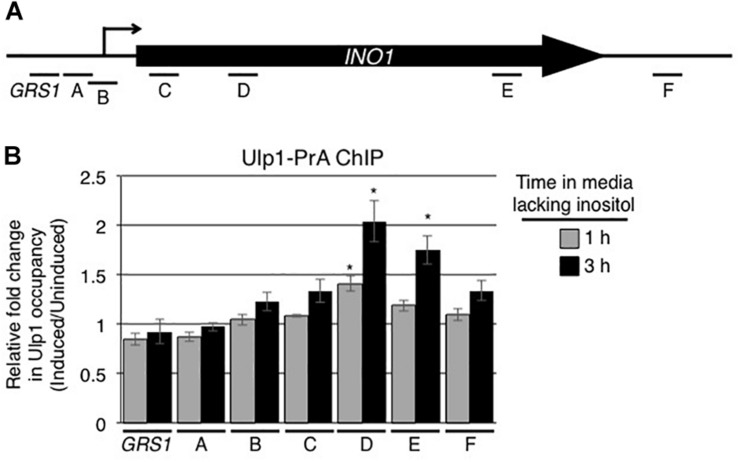
FIGURE 4.
Ulp1 interacts with the induced INO1 gene. (A) Diagram of the INO1 locus and regions detected by ChIP analysis (see Figure 1A). (B) Cells producing protein A tagged Ulp1 (Ulp1-PrA) were grown as described in the Figure 1 legend, and harvested at 0, 1, and 3 h after INO1 induction. Changes in Ulp1-PrA occupancy throughout the INO1 locus upon induction were examined by ChIP and qRT-PCR using primer pairs that amplify regions of INO1 indicated in A. Relative fold change in Ulp1-PrA binding was determined as described for SUMO binding in Figure 1. Results are the means ± SEM of three biological replicates. Asterisks indicate a significant difference relative to uninduced as determined by a Student’s paired t-test. *p < 0.05.

