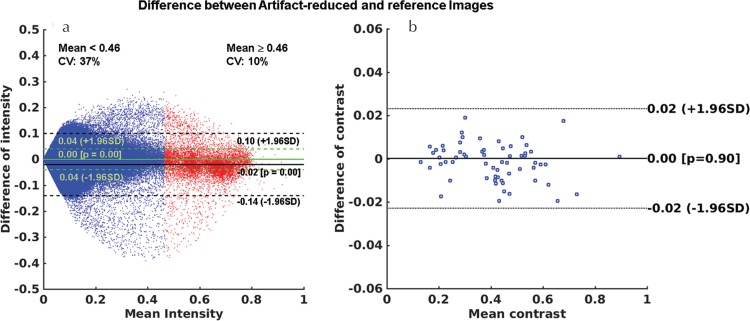
Fig. 9.
Bland–Altman plots for (a) the intensities and (b) the liver-to-aorta contrast ratio between the reference and artifact-reduced images in the validation dataset. The mean difference in the intensities was 0.00 (95% CI, −0.04 to 0.04) in the areas corresponding to mean intensity of <0.46 and −0.02 (95% CI, −0.14 to 0.10) in the parts with mean intensity of ≥0.46. Mean difference in the contrast ratio was 0.00 (95% CI, −0.02 to 0.02). These results indicated that there were no systematic errors in the contrast ratios, whereas the intensities of the artifact-reduced images were lower than that of the reference images owing to the effect of artifact reduction, especially in the area with high signal intensities. CI, confidence interval; CV, coefficient of variation.

