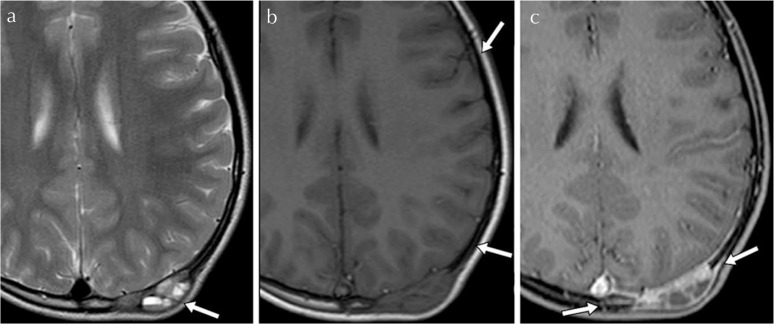
Fig. 2.
(a) T2-weighted image showing an expansive osteolytic cystic mass with multiple fluid–fluid levels (arrow). (b) T1-weighted image revealing low signal intensity changes in the adjacent bone marrow (arrows). (c) Post-contrast T1-weighted image showing enhancement of the adjacent pericranial soft tissue, dura mater, and bone marrow as well as of the mass (arrows).

