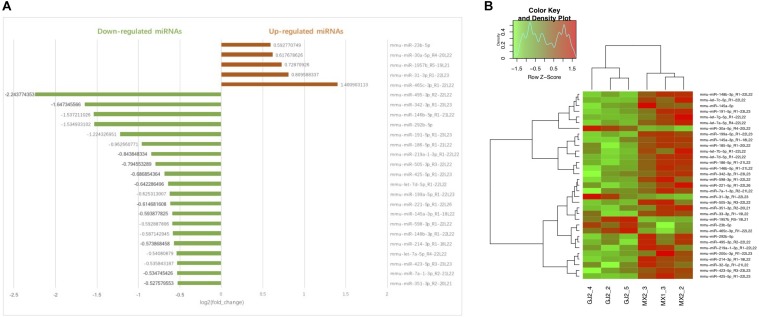
FIGURE 4.
Bar chart (A) and Hierarchical clustering (B) of DEMs in Model group and JTXK-treated group. (A) The abscissa of bar chart is log2(fold change) of DEMs. Red bars represent miRNAs significantly increased in JTXK-treated group, while the green bars represent the downregulated miRNAs (only the top 20 was illustrated). (B) Hierarchical clustering was generated according to the expression levels of miRNA, and a total of six samples were taken from either J group (JTXK-treated group) or M group (Model group). Green, significantly decreased; Red significantly increased.

