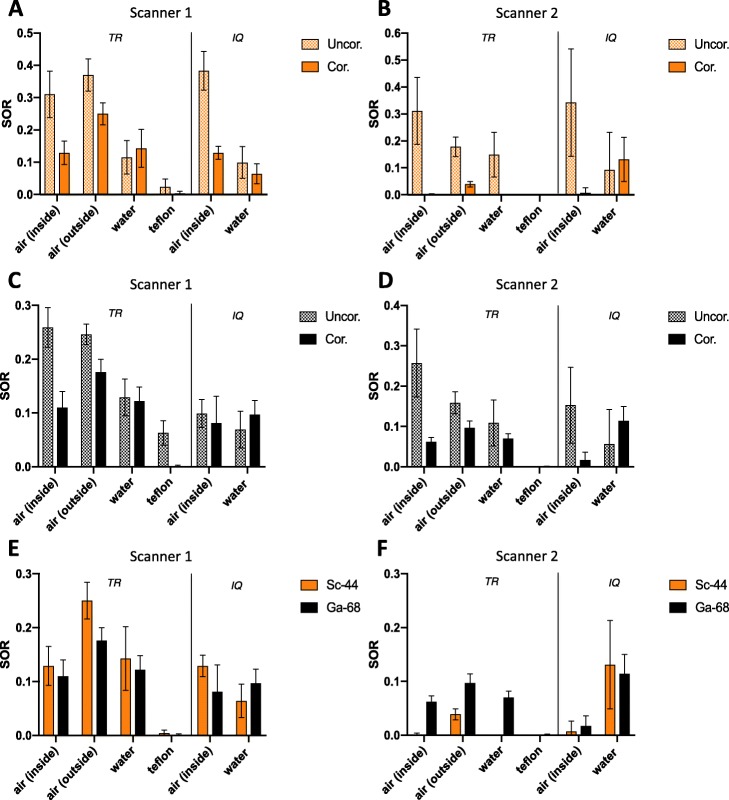
Fig. 4.
Spillover ratio (SOR) values of 44Sc (a, b) and 68Ga (c, d) with/without scatter and attenuation correction using three-rod (TR) and image quality (IQ) phantom on both PET systems and its comparison (e, f). Plotted are the calculated SOR values with their calculated errors. The values are also compiled in the supplementary material (Table S3). Uncor. without scatter and attenuation correction, Cor. with scatter and attenuation correction

