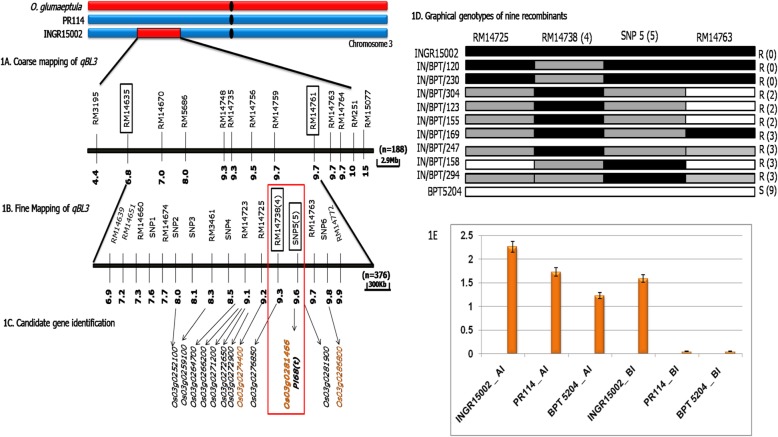
Fig. 1.
a The schematic representation of coarse mapped qBL3 region. The markers were arranged based on their physical position in comparison with Nipponbare genome (The physical positions of the markers were retrieved the Gramene – Supplementary table 18 of class I SSRs (https://archive.gramene.org/markers/microsat/). b The schematic representation of fine mapped qBL3 region. The numbers in parenthesis indicates the number of recombinants. The markers in encircled are the linked markers. c The gene Os03g0281466 within the fine mapped region which is up-regulated in microarray based transcriptome studies and validated through qPCR. Of the 12 up regulated genes in microarray, only three genes are consistent with qPCR (indicated by Red color). The gene Os03g0281466 is the only gene which is up-regulated in both microarray and qPCR and is falling with in the fine mapped region of qBL3. d Graphical genotypes of recombinants for the markers RM14738 and SNP5. R- resistant; S - Susceptible. The number in parenthesis is the phenotype score in SES (0–9) scale. The number on the left are the plant entry number. e Bar graph demonstrating the fold change difference in Os03g0281466 which is induced in INGR15002 upon pathogen infection in qPCR

