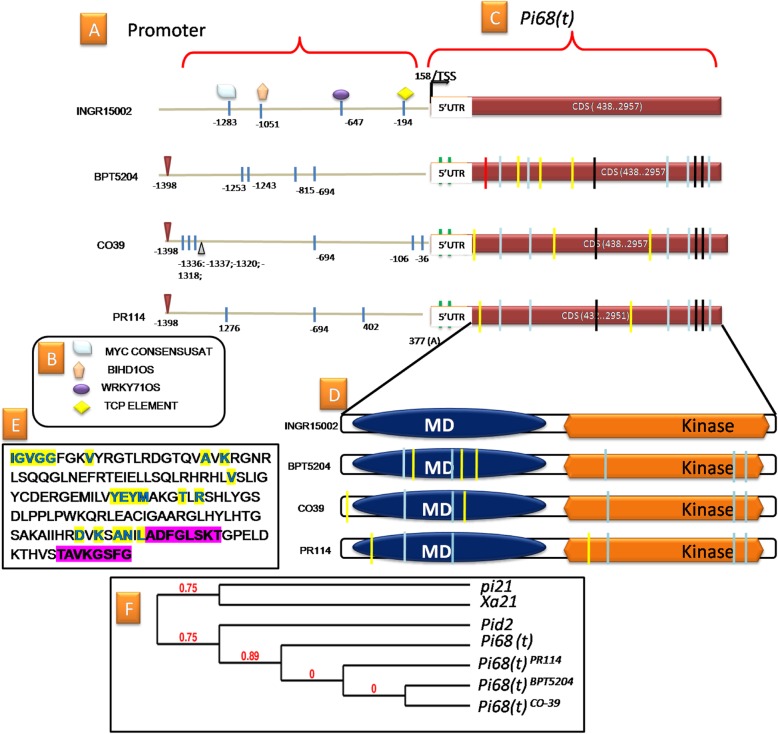
Fig. 2.
Promoter and gene characterization of Pi68(t) alleles in resistant and susceptible lines. a The number written in the promoter region indicates the position of SNPs identified in each sequence. The SNP leading to the presence/absence of TFBM was shown using different shapes. The triangle (Black) in CO39 promoter indicates the single base pair deletion and the triangle (red) indicate single base pair insertion. b The list of TFBMs identified in the promoter region and function of each motif is given in Table S12. c The TSS and coding sequence of Pi68. The two SNPs exist in the 5’UTR region were indicated in black bars. The blue bars in the coding sequence region indicate the common SNPs in the susceptible alleles leading to non synonymous changes. The black bars in the coding sequence region represent the common SNPs in the susceptible alleles leading to synonymous changes. The yellow bars in the coding sequence region are the allele specific SNPs leading to non synonymous changes. The red bars in the coding sequence region are the allele specific leading to synonymous changes. The position of the SNP and its Synonymous and Non Synonymous substitutions of amino acid are tabulated in Table S11. d The functional domains of the predicted protein. e The signature sequences of the active and ATP binding sites were highlighted in yellow and the signature sequences of Activation Loop and polypeptide binding site were highlighted in pink. f Cladogram representing the relationship of the Pi68 with earlier reported kinases of rice blast (pi21; Pid2) and bacterial blight (Xa21)

