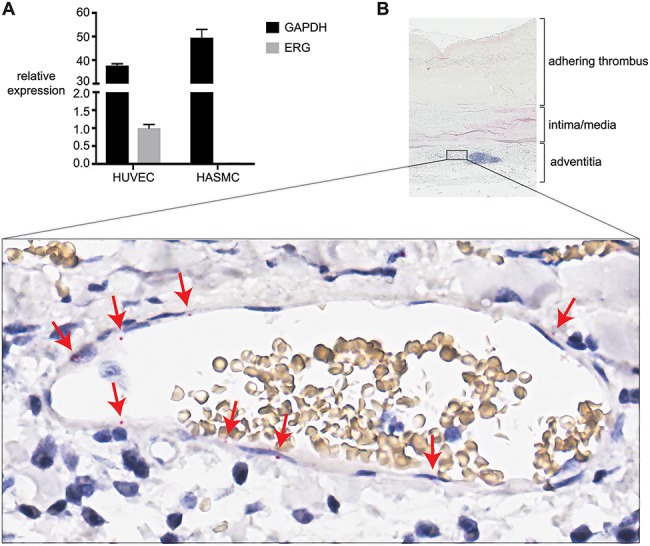
Figure 2.

ERG is specifically expressed in vascular endothelial cells. (A) The expression of total ERG (all isoforms) and GAPDH was measured by qPCR in two different HUVEC lines and three different HASMC lines. ERG expression values were normalized to the GeoMean of the reference genes GAPDH and RPL13A and are expressed relative to ERG in HUVECs. The mean ± the standard error of the mean is shown. (B) RNAscope® was used to detect the presence of ERG transcripts in AAA tissue section. Part of the section is shown on top, with below it a zoomed-in view of a vasa vasorum located next to a lymphoid aggregate (purple cluster of cells in total view). Staining of ERG transcripts in endothelial cells lining the lumen (red dots) is indicated by red arrows.
