
Figure E1: Causes of death among PWID and ex-PWID; 2020–2040.
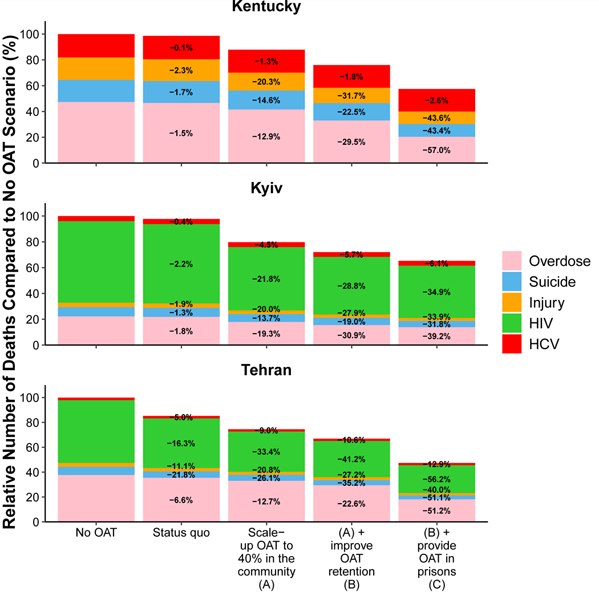
Figure shows the median percentage of deaths due to overdose, suicide, injury, HIV, HCV or other causes under the following strategies: if there were no OAT from 2020; if OAT was scaled-up to 40% coverage among PWID in the community; if OAT was scaled-up to 40% coverage among PWID in the community and the average duration of OAT is increased to 2-years; if OAT was scaled-up to 40% coverage among PWID in the community, incarcerated PWID enrol onto OAT at the same rate and the average duration of OAT is increased to 2-years. Deaths from other natural causes which account for 22%, 54% and 82% of deaths in Tehran, Kiev and Kentucky in Status Quo projections, respectively, are not shown.