FIGURE 4.
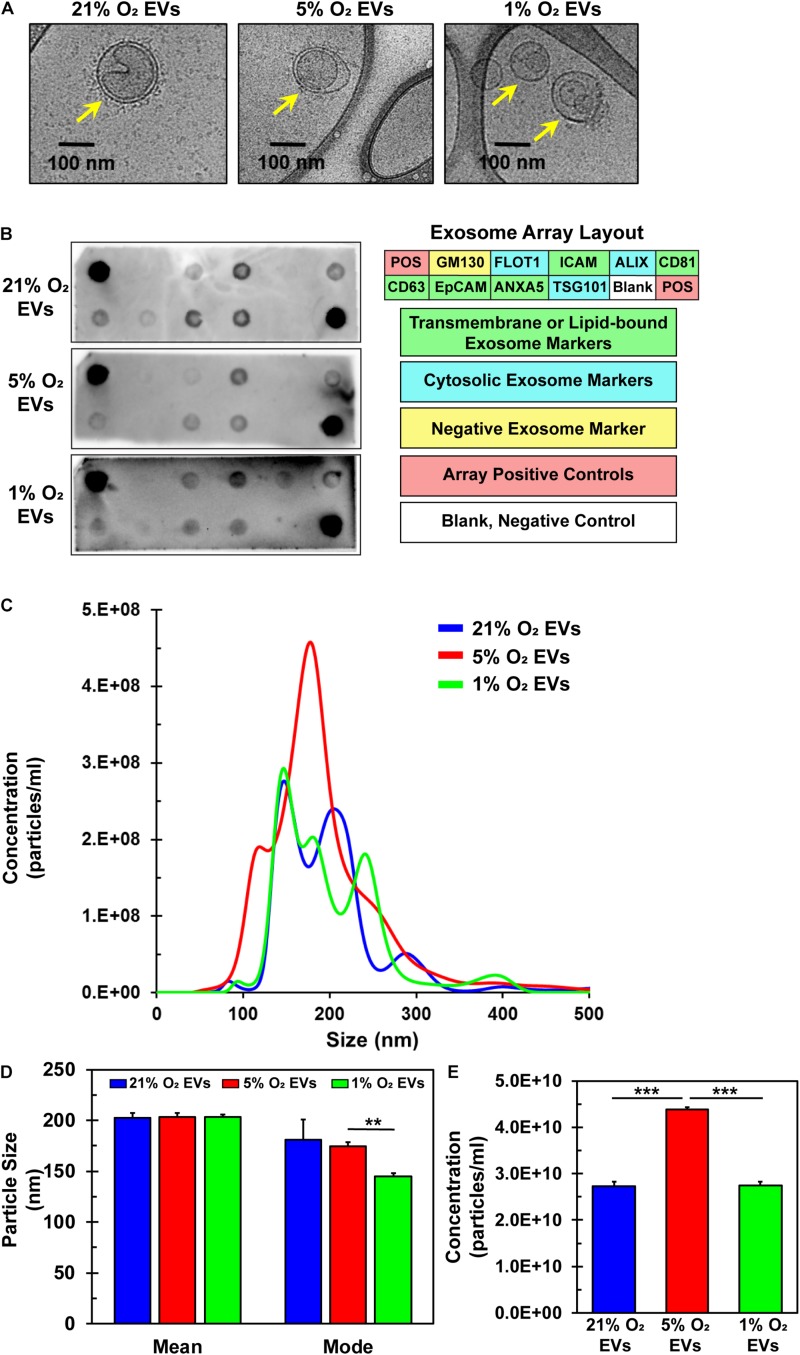
Characterization of EVs derived from hCPCs under varying oxygen microenvironment. hCPCs were cultured under three different oxygen condition (21, 5, and 1% O2) to generate EVs for analysis. (A) Cryo-TEM of isolated EVs shows their characteristic morphology of a round shape with a lipid bilayer (yellow arrows), which was identified under all three conditions. (B) EVs derived from 21, 5, and 1% O2 hCPCs were analyzed with an exosome antibody array for known exosome markers and a negative exosome marker. The isolated EVs from all three O2 conditions met the ISEV minimum requirements for identification. (C) NTA of triplicate samples shows the size and concentration distribution of EVs. (D) Mean and mode sizes of isolated EVs were similar and within the accepted range for extracellular vesicles, data is mean ± SD, n = 3. (E) The concentration of EVs isolated from hCPCs cultured under 5% O2 microenvironment was higher than 21 and 1% O2 groups, data is mean ± SD, n = 3. **p < 0.01, ***p < 0.001.

