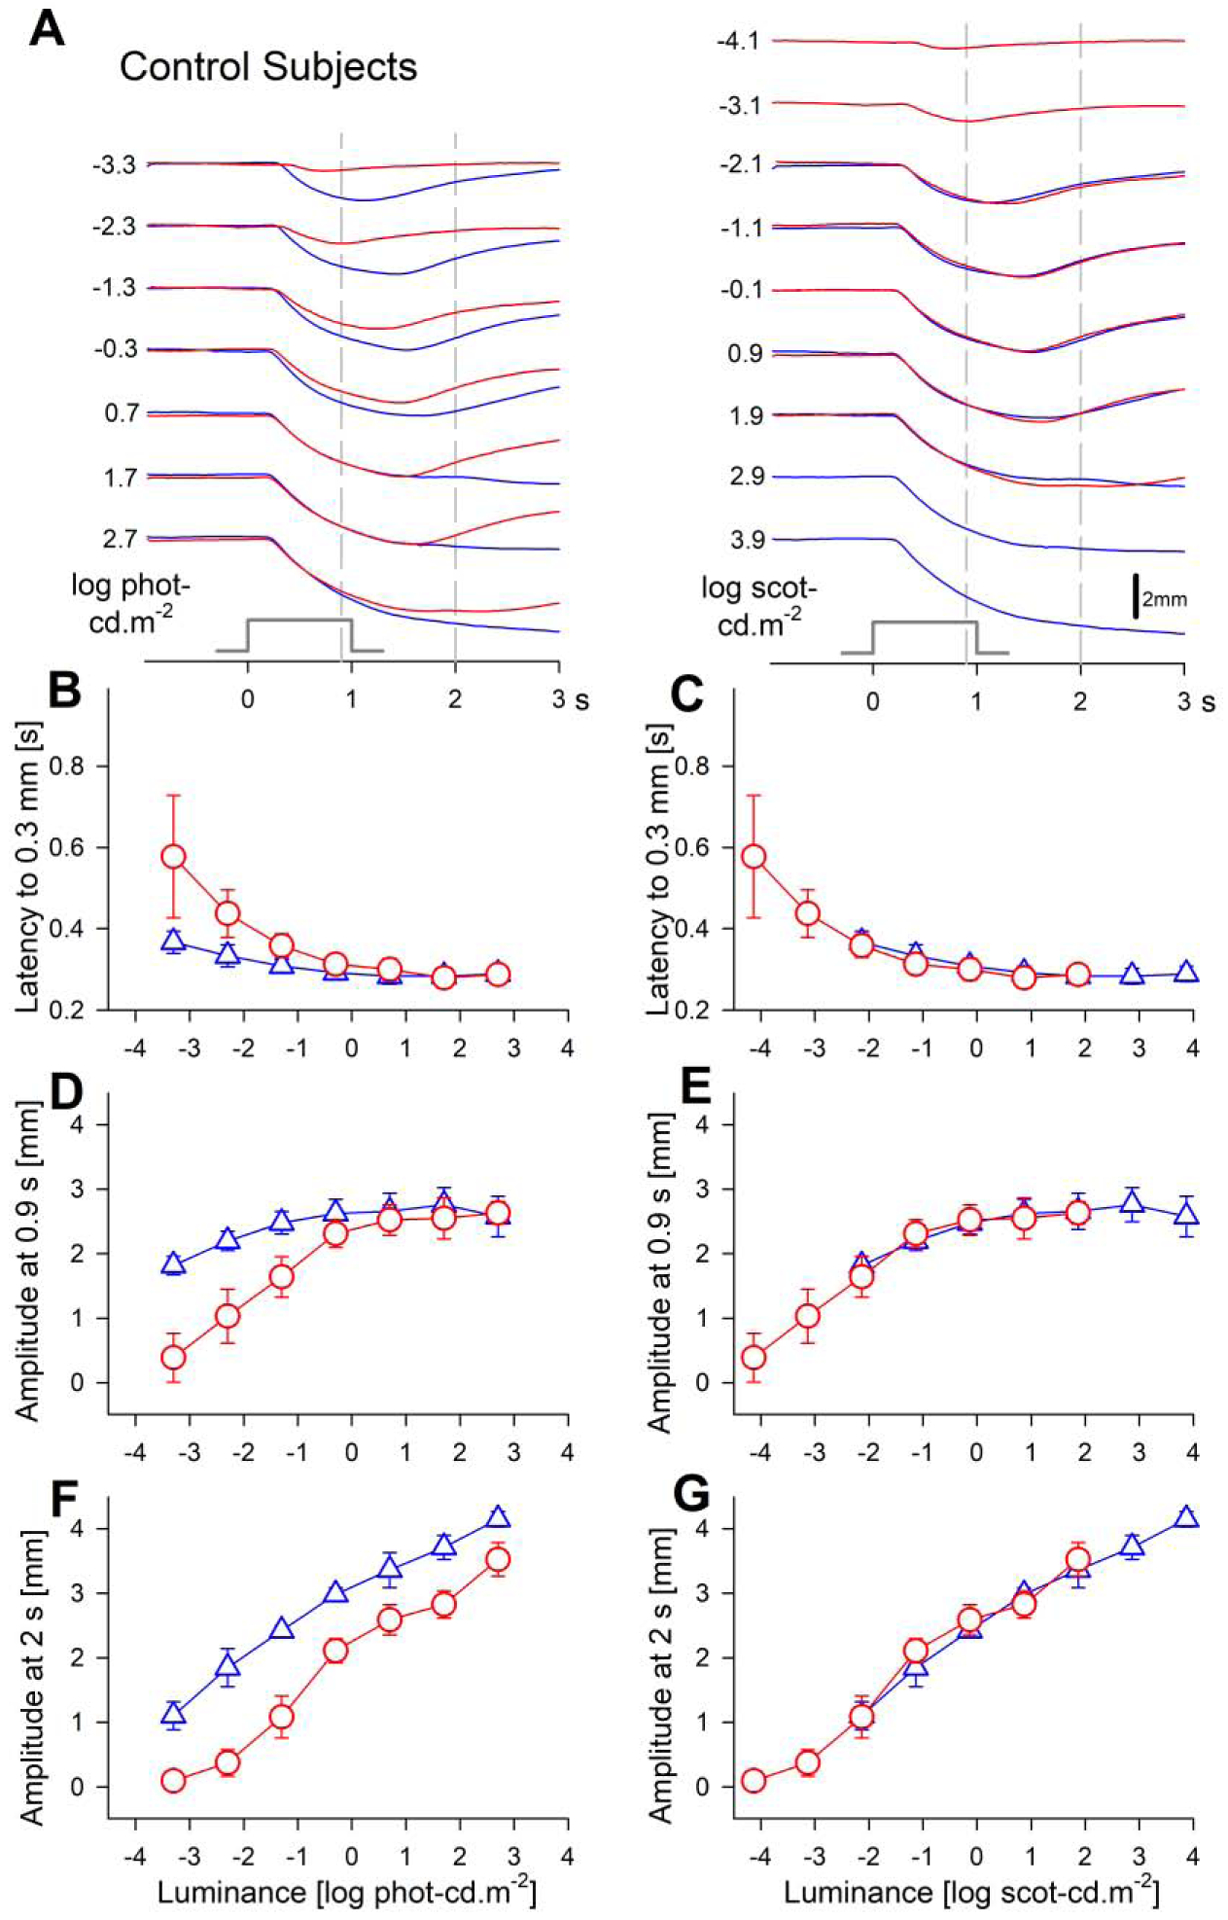
Fig. 2.

Transient pupillary light responses in dark-adapted control subjects evoked with red and blue stimuli over a 6-log unit dynamic range. (A) Traces of pupil diameter as a function of time for red and blue stimuli. Responses to photopically (left) and scotopically (right) paired chromatic stimuli are shown. Time zero corresponds to the onset of 1 second long stimuli (stimulus monitor shown). Vertical gray dashed lines depict the fixed times (0.9 and 2 s) when the amplitude of the pupillary constriction was measured. (B, C) The response latency to reach a criterion amplitude accelerates with increasing luminance to reach a plateau near 0.3 s. (D–G) Response amplitudes show saturation near 2.6 mm when measured at the early time of 0.9 s, but monotonic increase with luminance when measured at a later time of 2 s. Parameters associated with red stimuli are shown with red circles, and blue stimuli with blue triangles. Error bars represent ±1 sd.
