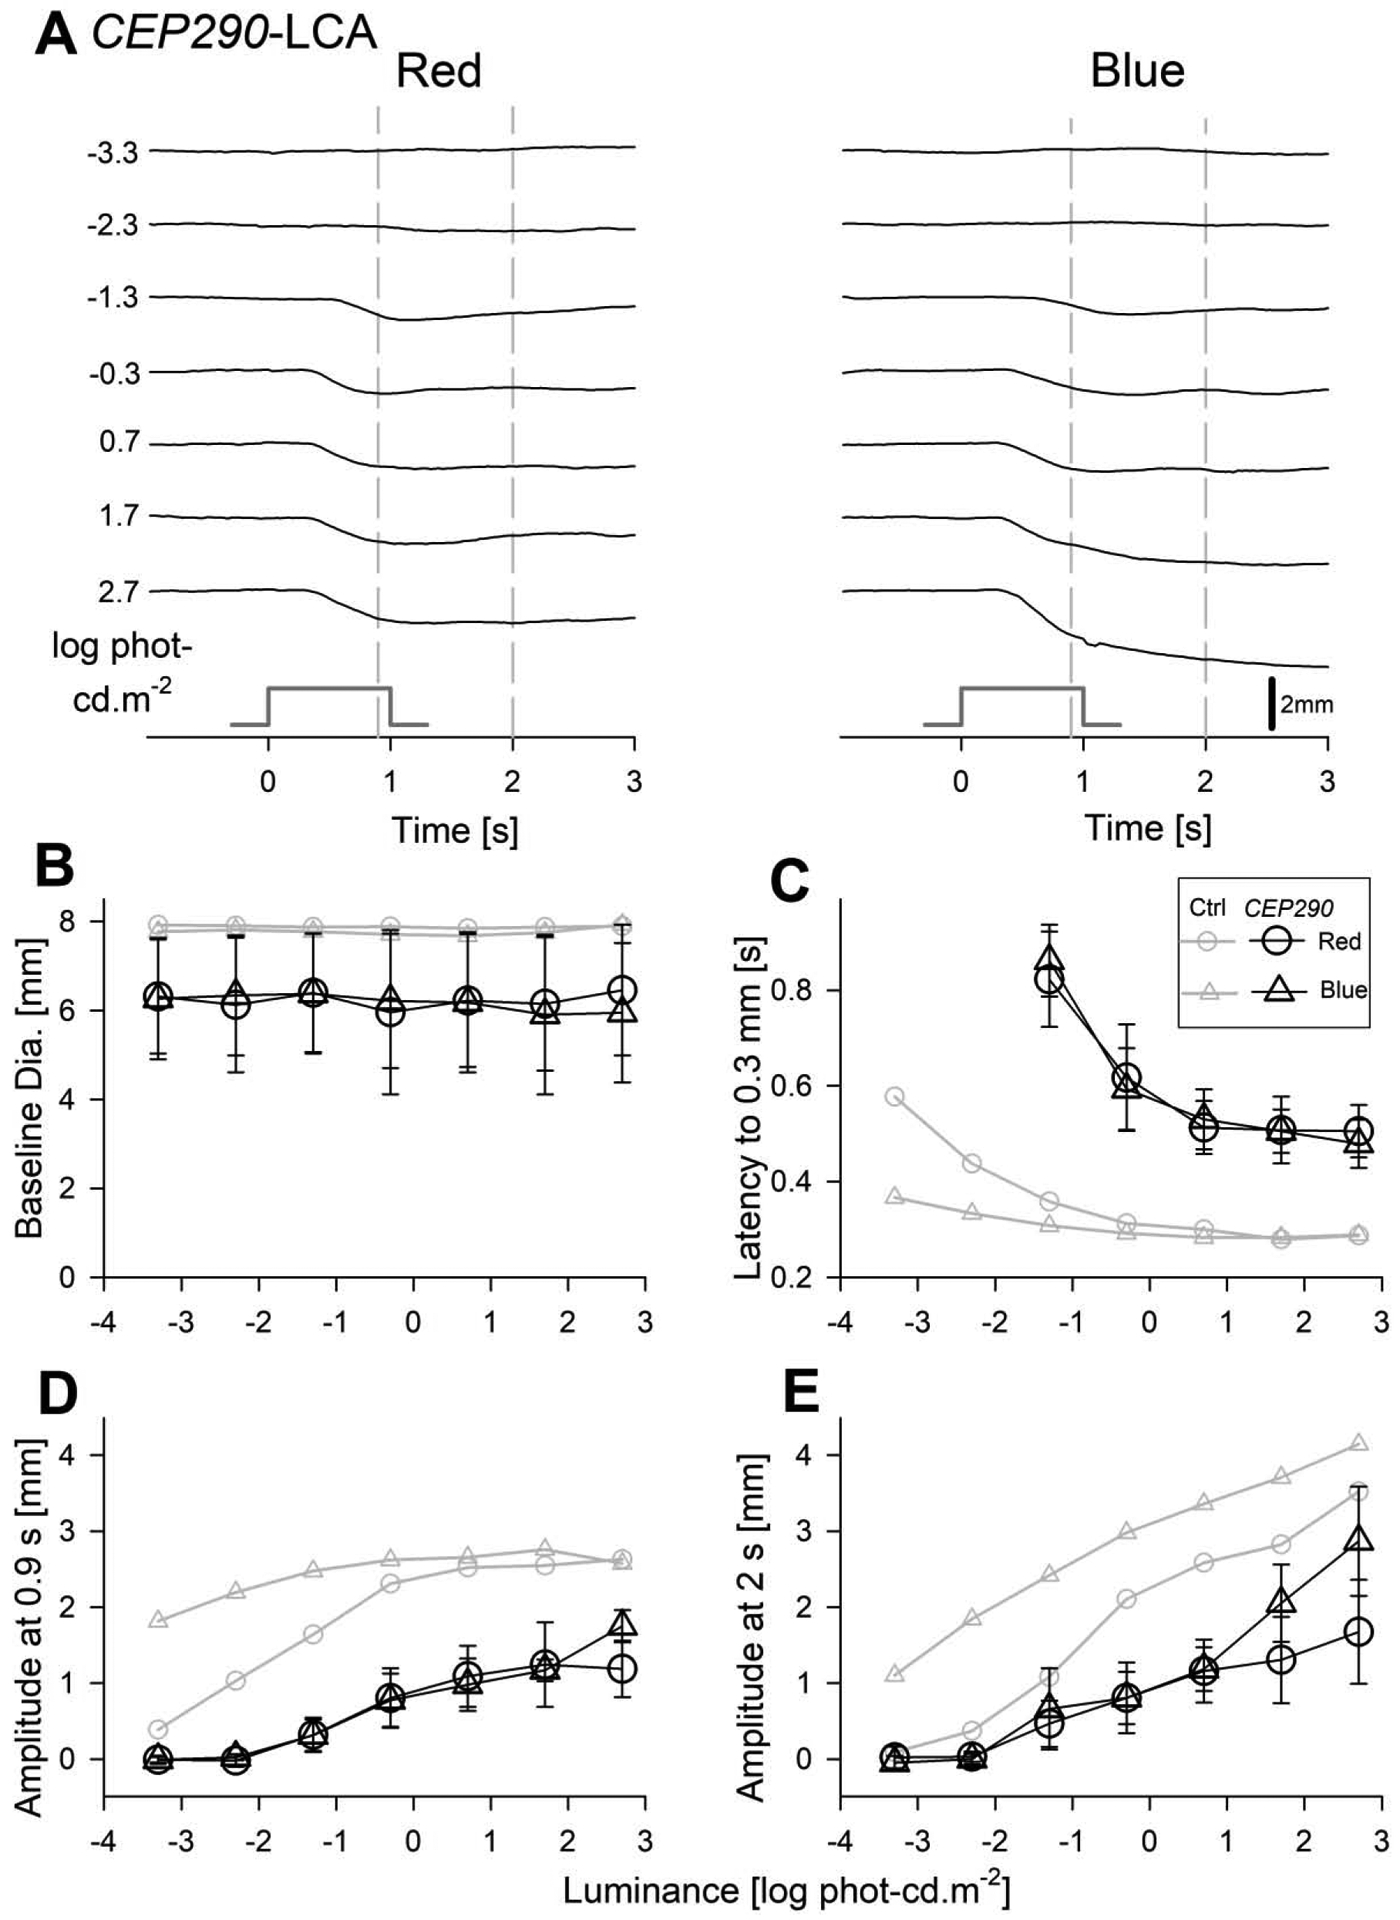
Fig. 3.

Transient pupillary light responses in dark-adapted CEP290-LCA eyes evoked with red and blue stimuli over a 6-log unit dynamic range. (A) Traces of pupil diameter as a function of time for red (left) and blue (right) stimuli in the right eye of the subject S3. Responses are absent for the two dimmest light levels but detectable thereafter. Time zero corresponds to the onset of 1 second long stimuli (stimulus monitor shown). Vertical gray dashed lines depict the fixed times (0.9 and 2 s) when the amplitude of the pupillary constriction was measured. (B) The baseline pupil diameters are invariant as a function of luminance but were smaller than the control (Ctrl) subjects (gray symbols). (C) The response latency to reach criterion amplitude is similar with red and blue stimuli when plotted on photopic axis. Latency accelerates with increasing luminance to reach a plateau of near 0.5 s which is substantially slower than that of controls. (D, E) Response amplitudes show monotonic increase with luminance at both 0.9 s and 2 s. Amplitudes at all light levels and at both time points are consistently smaller than in controls. Parameters associated with red stimuli are shown with circles, and blue stimuli with triangles. Average data from controls is shown with unfilled gray symbols. Error bars represent ±1 sd.
