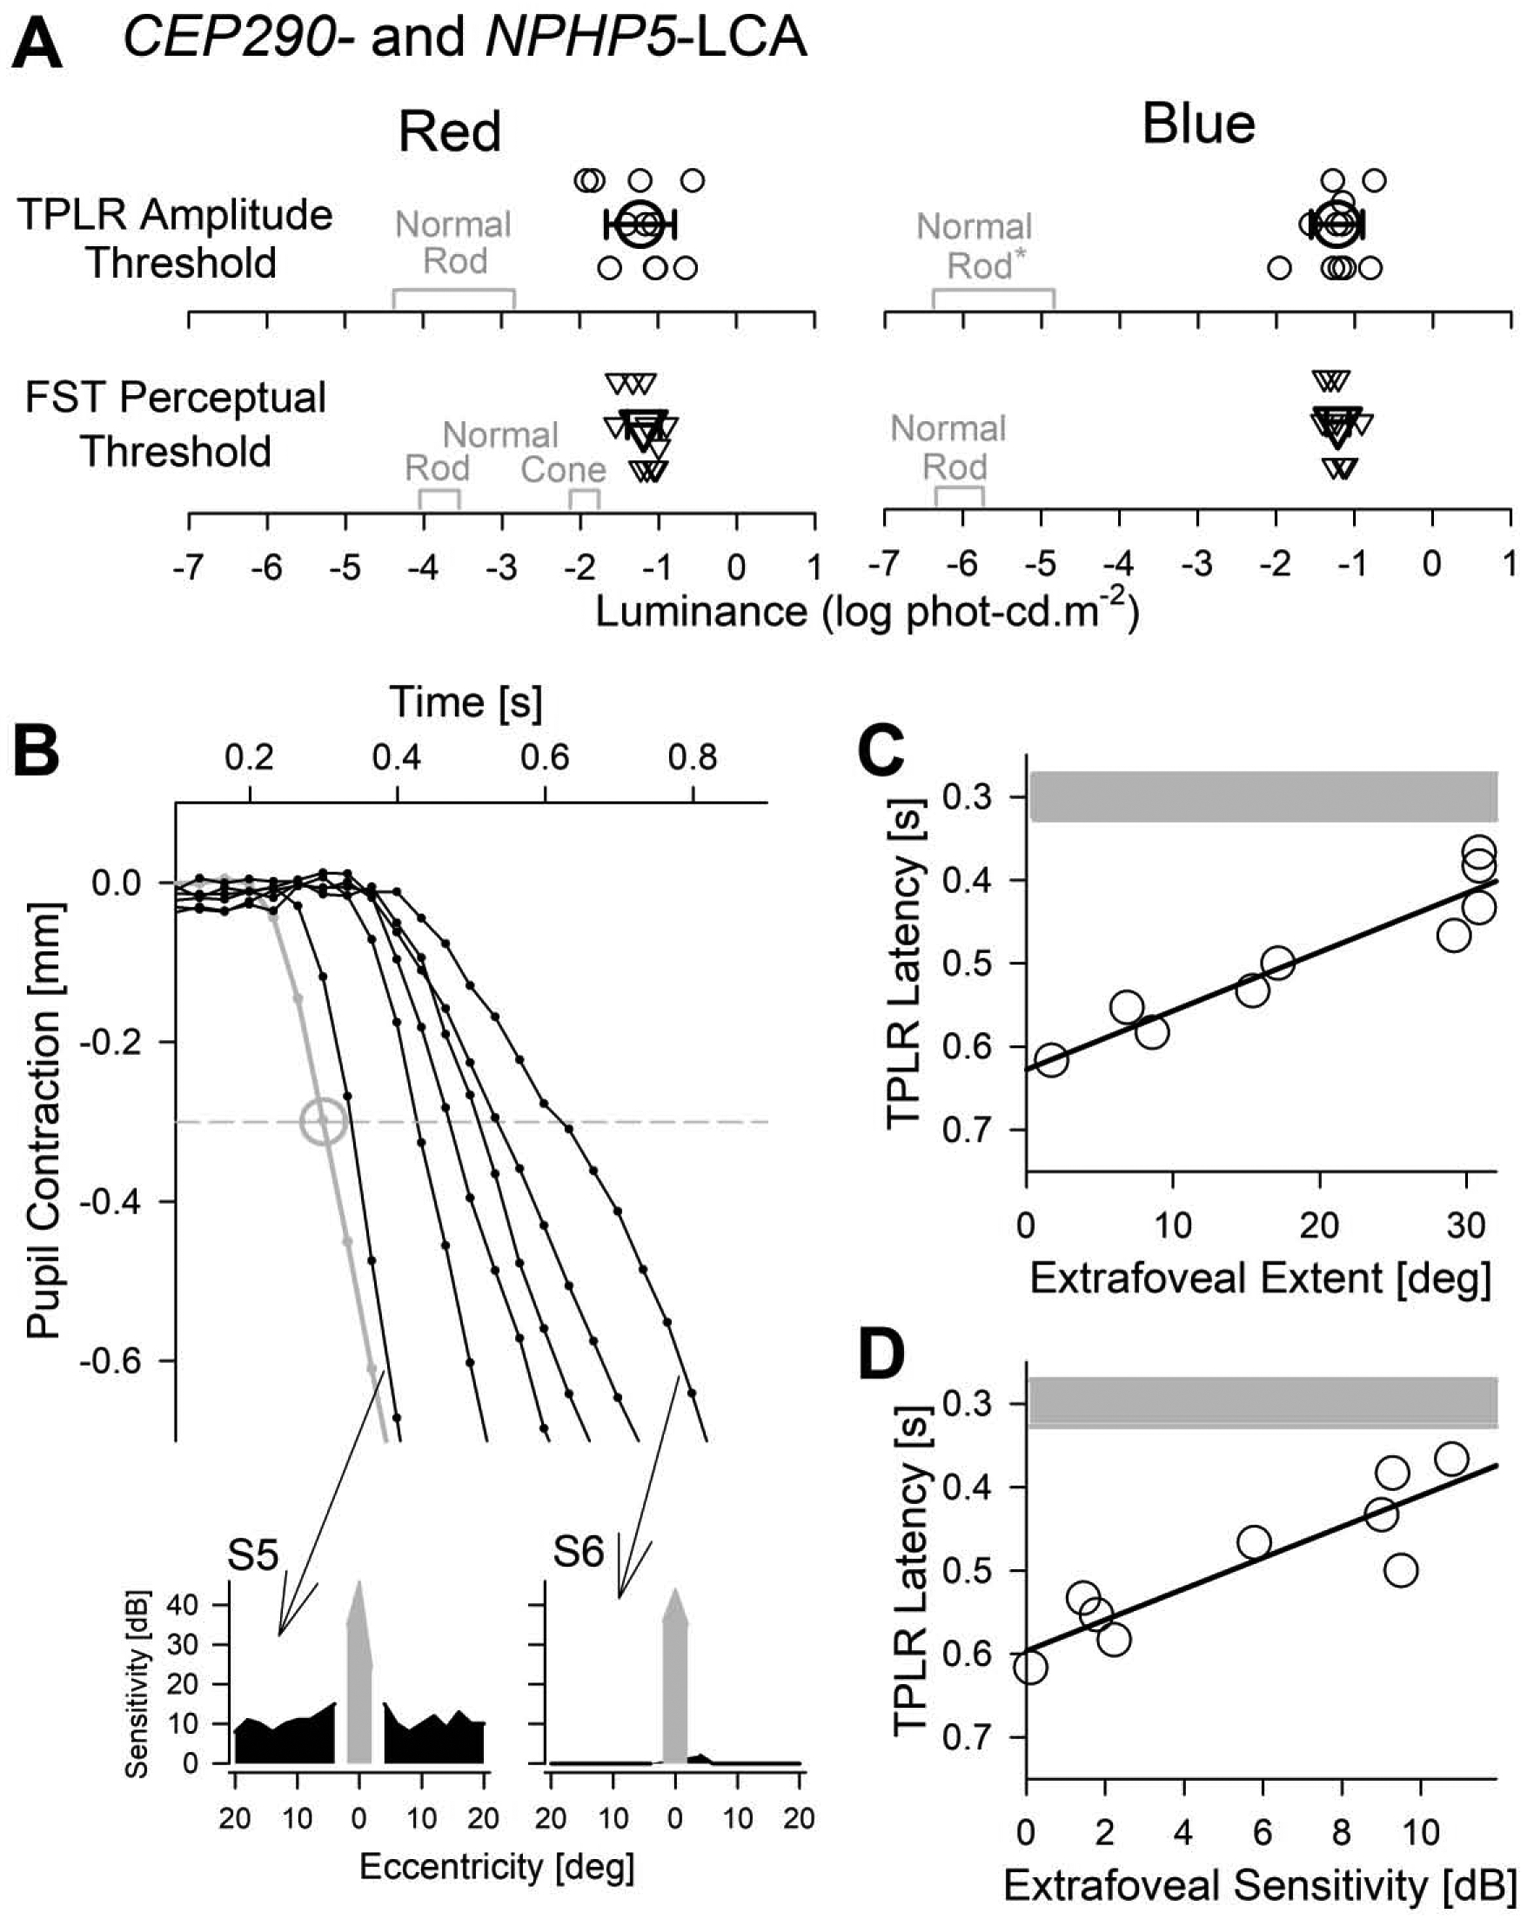
Fig.5.

Comparison of TPLR parameters with perception. (A) TPLR amplitude (at 0.9 s) thresholds to reach a criterion of 0.3 mm compared to perceptual full-field stimulus testing (FST) thresholds for red (left) and blue stimuli (right). Values from individual eyes are shown with small symbols and average across all eyes as large symbols (error bars=±1 sd). Normal values driven by the rod system in TPLR, and by rod and cone systems in FST are shown (gray). Normal blue TPLR values (*) are assumed to be equal to red TPLR thresholds in scotopic units. (B) Enlarged view of the initial TPLR constriction phase with the 0.7 log phot-cd.m−2 (5 cd.m−2) red stimulus in a representative normal (gray) and one representative trace from each of the six patients (black). Large gray circle shows the average normal (with ±1 sd error bars). Insets below show the perimetric thresholds with white stimuli in dark-adapted conditions obtained along the horizontal profile in two patients (S5,S6) with the slowest and the fastest TPLR latencies; parafoveal remnant vision shown with black, foveal vision with gray. (C, D) TPLR latency for the 0.7 log phot-cd.m−2 (5 cd.m−2) red stimulus as a function of the extent of extrafoveal vision (C) and average extrafoveal retinal sensitivity (D) as estimated with dark-adapted static perimetry with a white stimulus. Note the inverted y-axis. Linear regression lines (black) and normal range (mean±sd) of latencies (gray) are shown.
