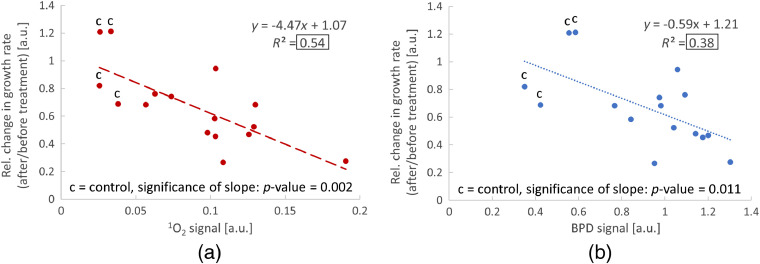
Fig. 8.
Correlation of PDT treatment efficiency to the generated singlet oxygen and PS: (a) correlation of relative change in tumor growth rate (ratio of growth rates after/before PDT treatment) to measured singlet oxygen amount for all mice. (b) Correlation of relative change in tumor growth rate to measured PS amount for all mice (). In both plots, “” indicates control mice.

