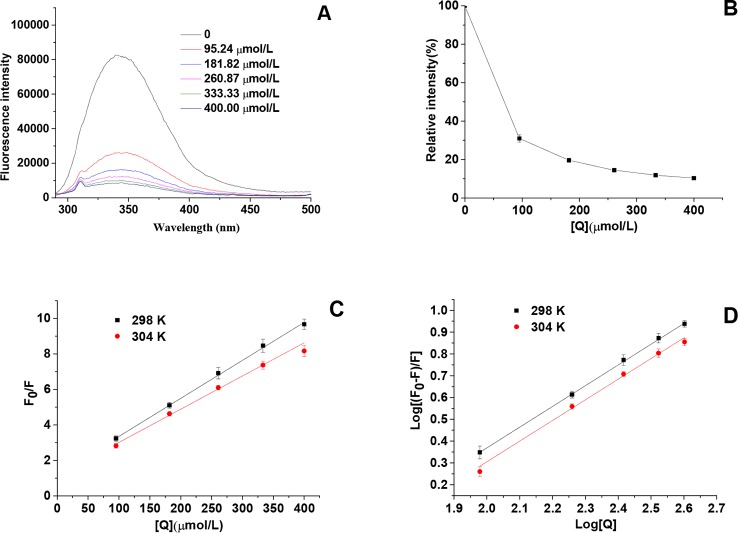
Figure 5.
(A) Intrinsic fluorescence spectra of tyrosinase in the presence of HgCl2 at various concentrations, which were 0, 95.24, 181.82, 260.87, 333.33, and 400.00 μmol/L for curves, respectively. (B) Relative intensity (%) of tyrosinase at various concentrations of HgCl2 (298K). (C) The Stern–Volmer plots for the fluorescence quenching of tyrosinase at various temperatures (298 and 304 K). (D) Plots of log [(F0−F)/F] against log [Q] at various temperatures (298 and 304 K). F0 and F are the fluorescence intensities of tyrosinase in the absence and presence of HgCl2, and [Q] represents the concentration of HgCl2. The experiment was repeated three times (n = 3).

