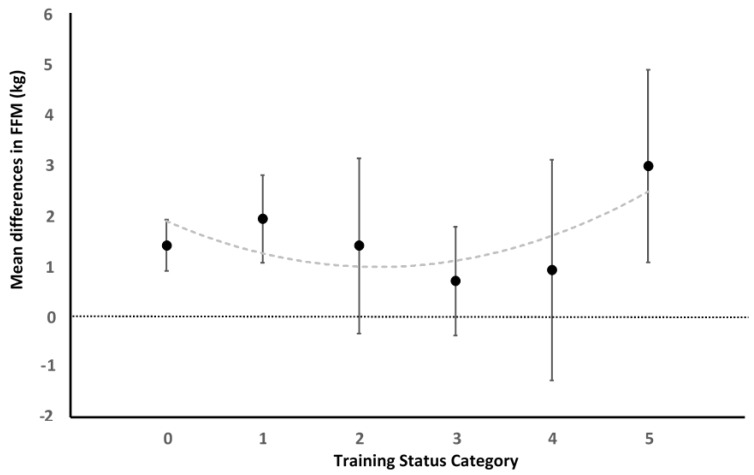
Figure 4.
Mean differences exploration comparing the training status by categories. Sedentary = 0: 1.39 kg 95% CI [0.89, 1.90], p < 0.001; I2 = 0%, p = 0.89; untrained = 1: 1.92 kg 95% CI [1.05, 2.78], p < 0.001; I2 = 0%, p = 1.00; Up to one year experience = 2: 1.39 kg 95% CI [−0.35, 3.12], p = 0.12; I2 = 0%, p = 1.00; Up to two year experience = 3: 0.69 kg 95% CI [−0.39, 1.76], p =0.21; I2 = 0%, p = 1.00; Up to tree year experience = 4: 0.9 kg 95% CI [−1.28, 3.09], p = 0.42; I2 = 0%, p = 1.00; RT experience of 4 years or more = 5: 2.96 kg 95% CI [1.06, 4.87], p = 0.002; I2 = 41%, p = 0.08.

