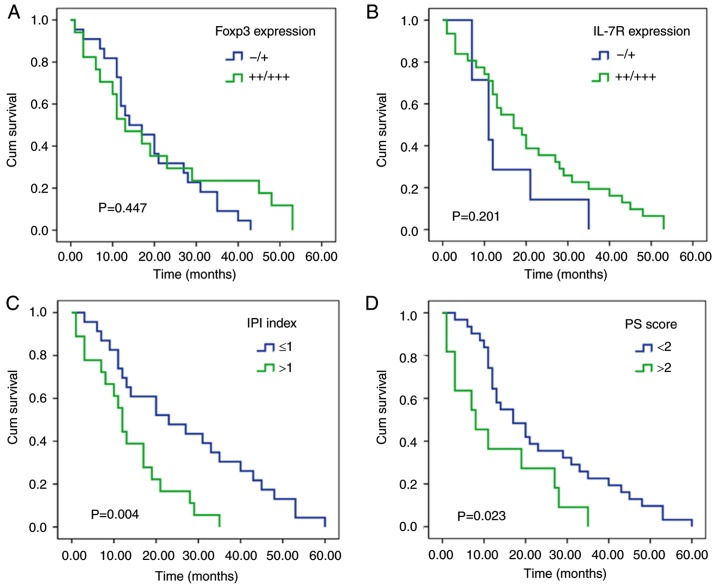
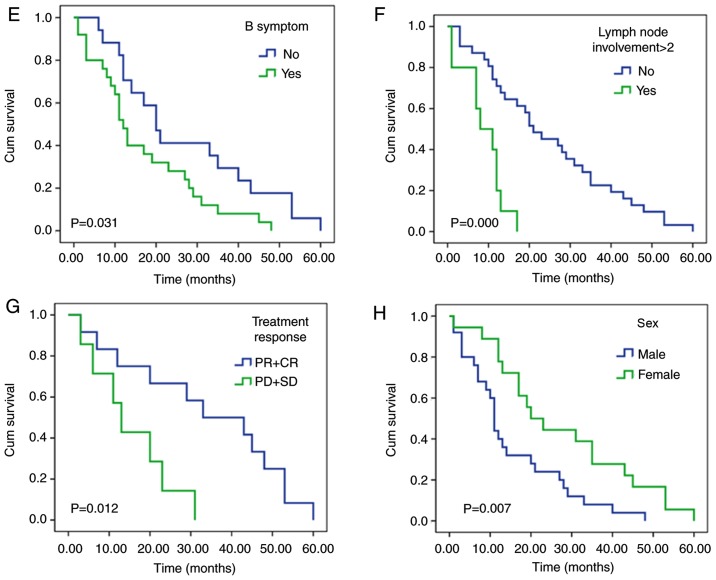
Figure 4.
Survival analysis. (A) Survival curves of patients according to Foxp3 expression. (B) Survival curves of patients according to IL-7R expression. (C) Survival curves of patients according to IPI index. Patients with DLBCL and IPI index >1 exhibited poor overall survival time. (D) Survival curves of patients according to PS score. Patients with DLBCL and with PS score >2 exhibited poor OS. (E) Survival curves of patients according to B symptom. Patients with DLBCL and B symptom exhibited poor OS. (F) Survival curves of patients according to lymph node involvement >2. Patients with DLBCL and lymph node involvement >2 exhibited poor OS. (G) Survival curves of patients according to the different treatment response. Patients with DLBCL and PD+SD exhibited poor OS. (H) Survival curves of patients according to the sex. Men exhibited poor OS. DLBCL, diffused large B-cell lymphoma; Fox3P, forkhead/winged-helix protein 3; IL-R7, interleukin-7 receptor; IPI, International Prognostic Index; PD, progressive disease; PS, performance status; SD, stable disease; PR, partial response; CR, complete response.


