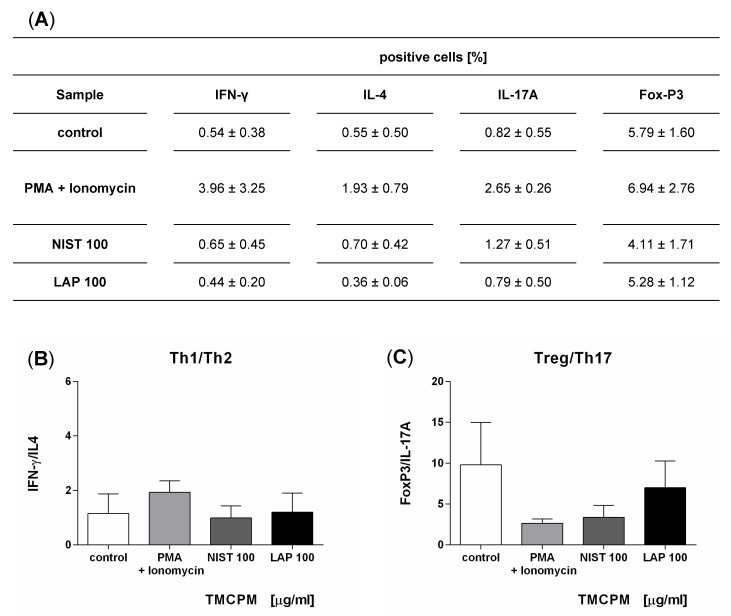
Figure 4.
Effect of the exposition of T lymphocytes to TMCPM (NIST or LAP) on the Th1/Th2 and Treg/Th17 ratios. T lymphocytes were stimulated with PMA (50 ng/mL) + ionomycin (100 ng/mL) (positive control) or with NIST or LAP (100 µg/mL). Percentage of Th1, Th2, Th17, and Treg cells was quantified as the frequency of cells positive for IFN-γ, IL-4, IL-17A and FoxP3, respectively (A). The frequency ratio (%) of IFN-γ positive to IL-4 positive CD4+ T cells (Th1/Th2) (B) and FoxP3 positive to IL-17A positive CD4+ T cells (Treg/Th17) (C), was calculated. Data are presented as the mean ± SEM from three independent experiments performed.

