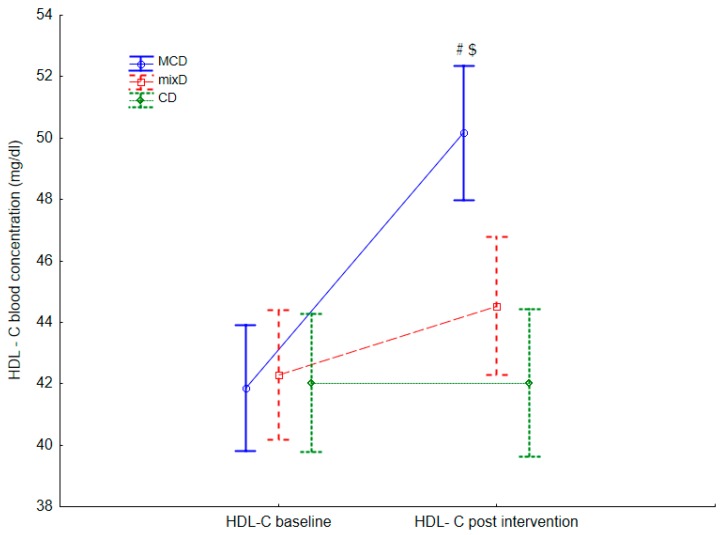
Figure 2.
Differences in HDL-C postintervention between the moderate-carbohydrate diet (MCD). Values are expressed as mean and standard deviation. Mix diet (MixD) and conventional diet (CD) groups; #—significant difference compared with base line, $—significant differences compared with the MixD and CD groups, respectively (p < 0.05).

