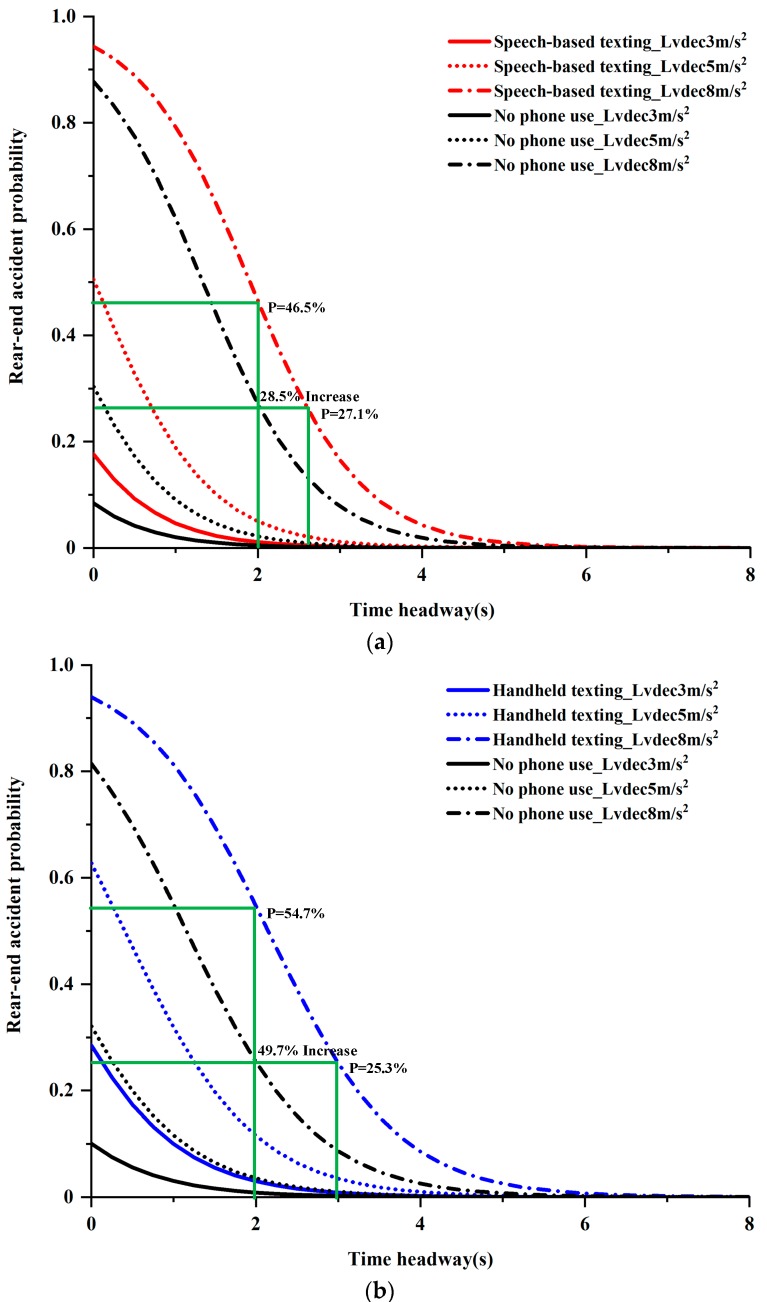
Figure 3.
Comparison of rear-end accident probabilities for non-distracted and distracted driving conditions with different time headways and LV deceleration rates. (a) Comparison of rear-end accident probability between speech-based texting and no phone use; (b) comparison of rear-end accident probability between handheld texting and no phone use.

