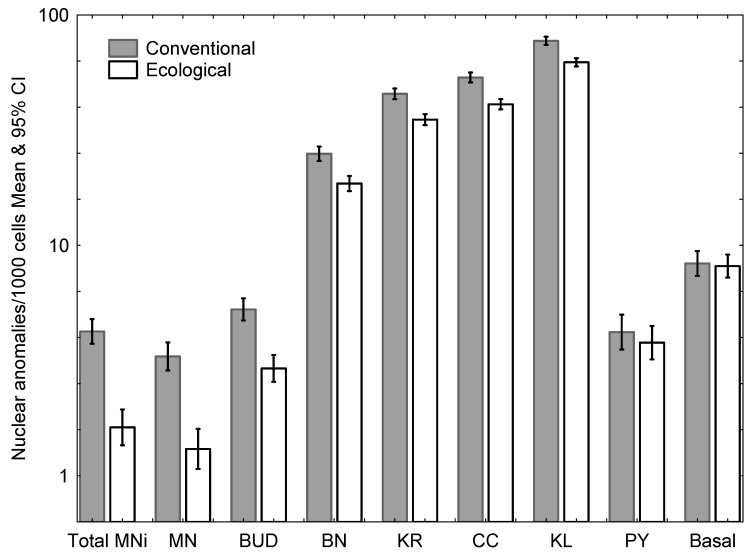
Figure 2.
Mean frequency (and 95% confidence intervals) of nuclear anomalies per 1000 cells in the groups of conventional (black) and ecological farmworkers (white). BN: Binucleated cells; KR: Karyorrhexis; CC: Condensed chromatin; KL: Karyolysis; Bottom: PY: Pyknosis; BASAL: Basal cells; Total MNi: Total number of micronuclei; MN: micronucleated cells (number of viewed cells with micronuclei); BUD: Cells with nuclear buds (“broken egg”).

